
The Postflop tab
How to find postflop leaks by analyzing your own game and that of your opponents.

Gandalf
Co-founder of Poker Sciences

Unlike preflop, where you can easily compare your game to a theoretical benchmark (the Poker Sciences charts or your own custom charts, for example), it's always a bit more complicated postflop which, let's be honest, given its immense combinatorial complexity, never boils down to a single universal answer.
The most relevant benchmark then becomes the pool of regular players at your stake. You often play roughly like they do (same preflop ranges, same adjustments), which makes the comparison directly actionable.
A good source of truth, without being 100% true. But if you play a spot fundamentally differently from the regulars at your stake, there's probably something worth digging into.
Concretely, the Postflop tab puts that comparison at your disposal on a decision tree: every situation of a context is displayed at once. By default, each situation shows your own game (Hero ); you can add, right below, the frequencies of the pool's fish and the pool's regs .
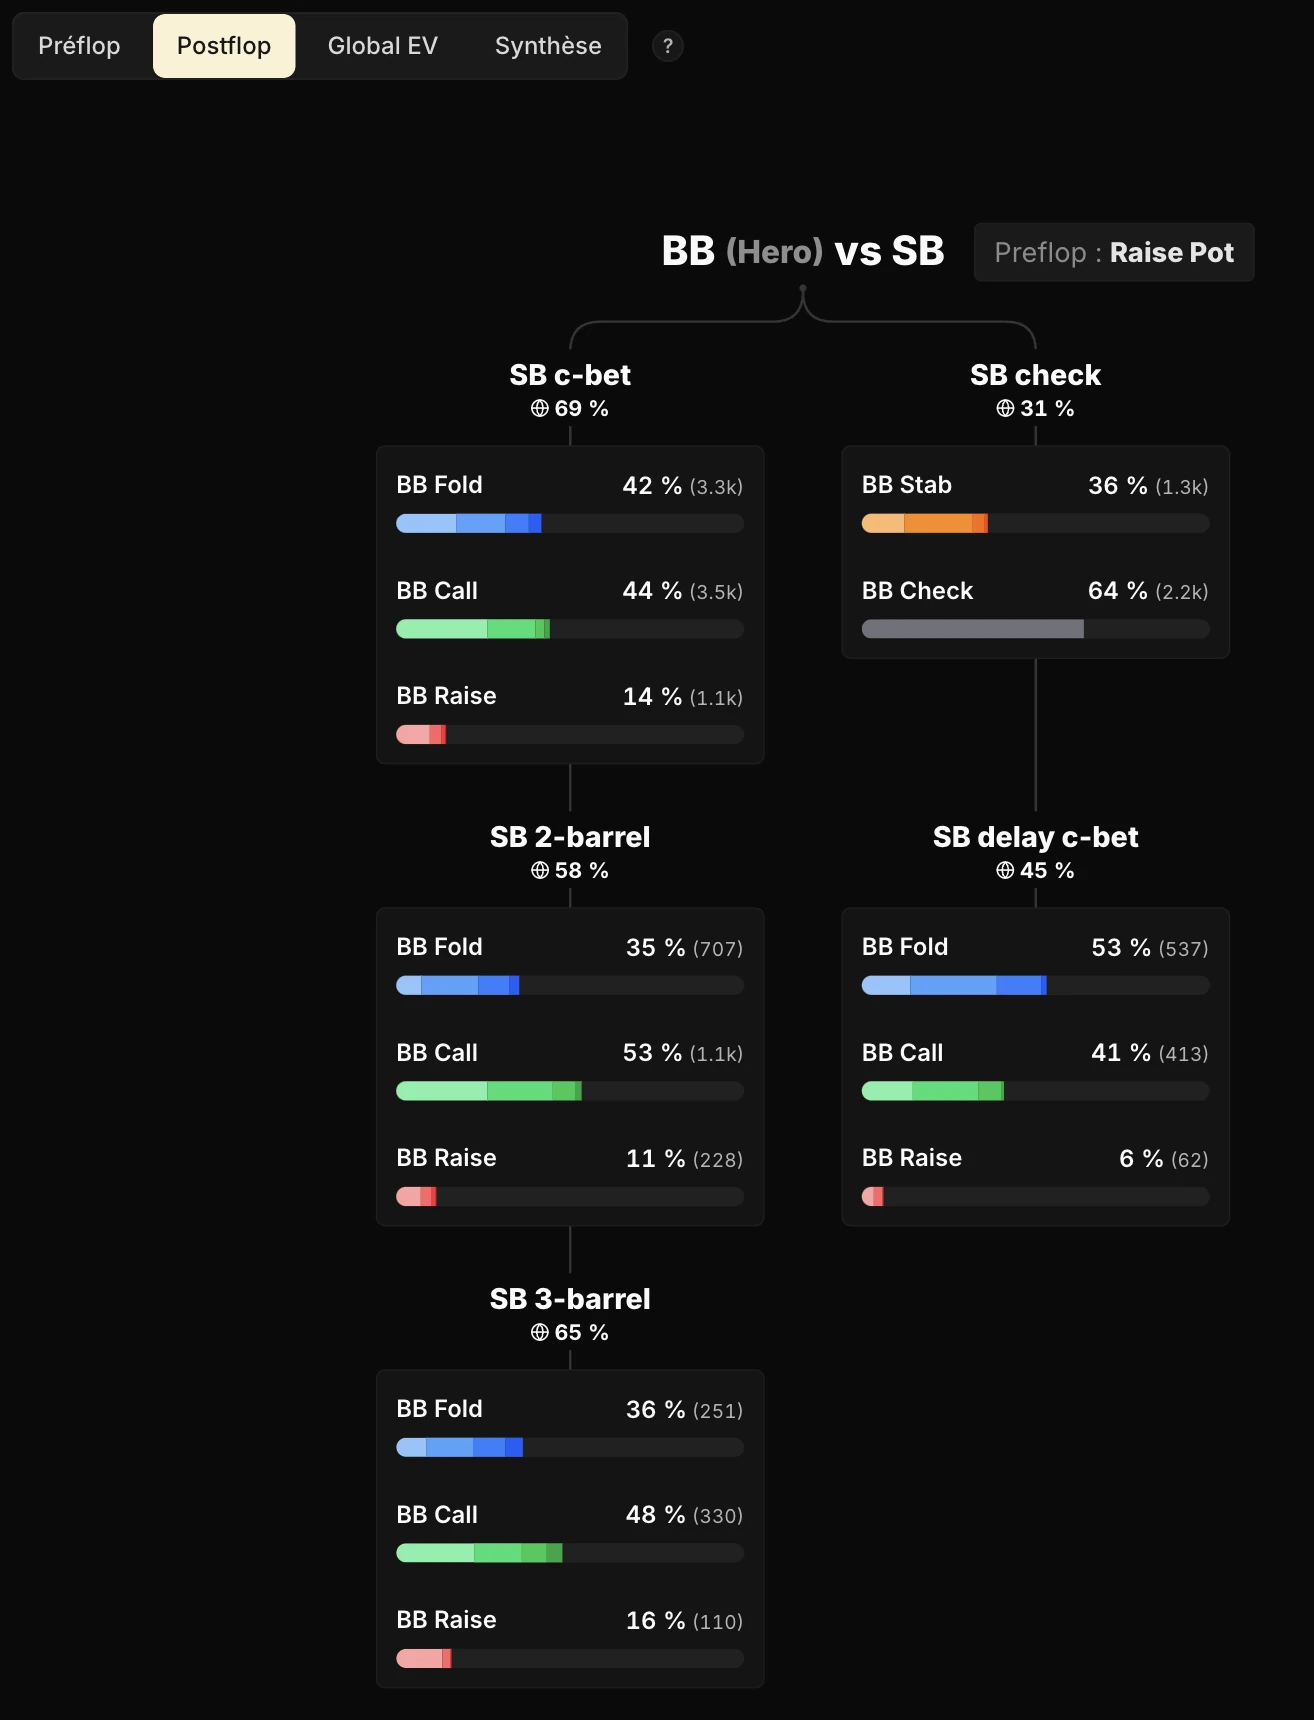
To compare, all you have to do is enable the other profiles (Fish , Reg , or any tag) from the profile selector, at the very top of the sidebar.
Once a profile is added, each situation displays one frequency bar per profile, stacked one under the other:
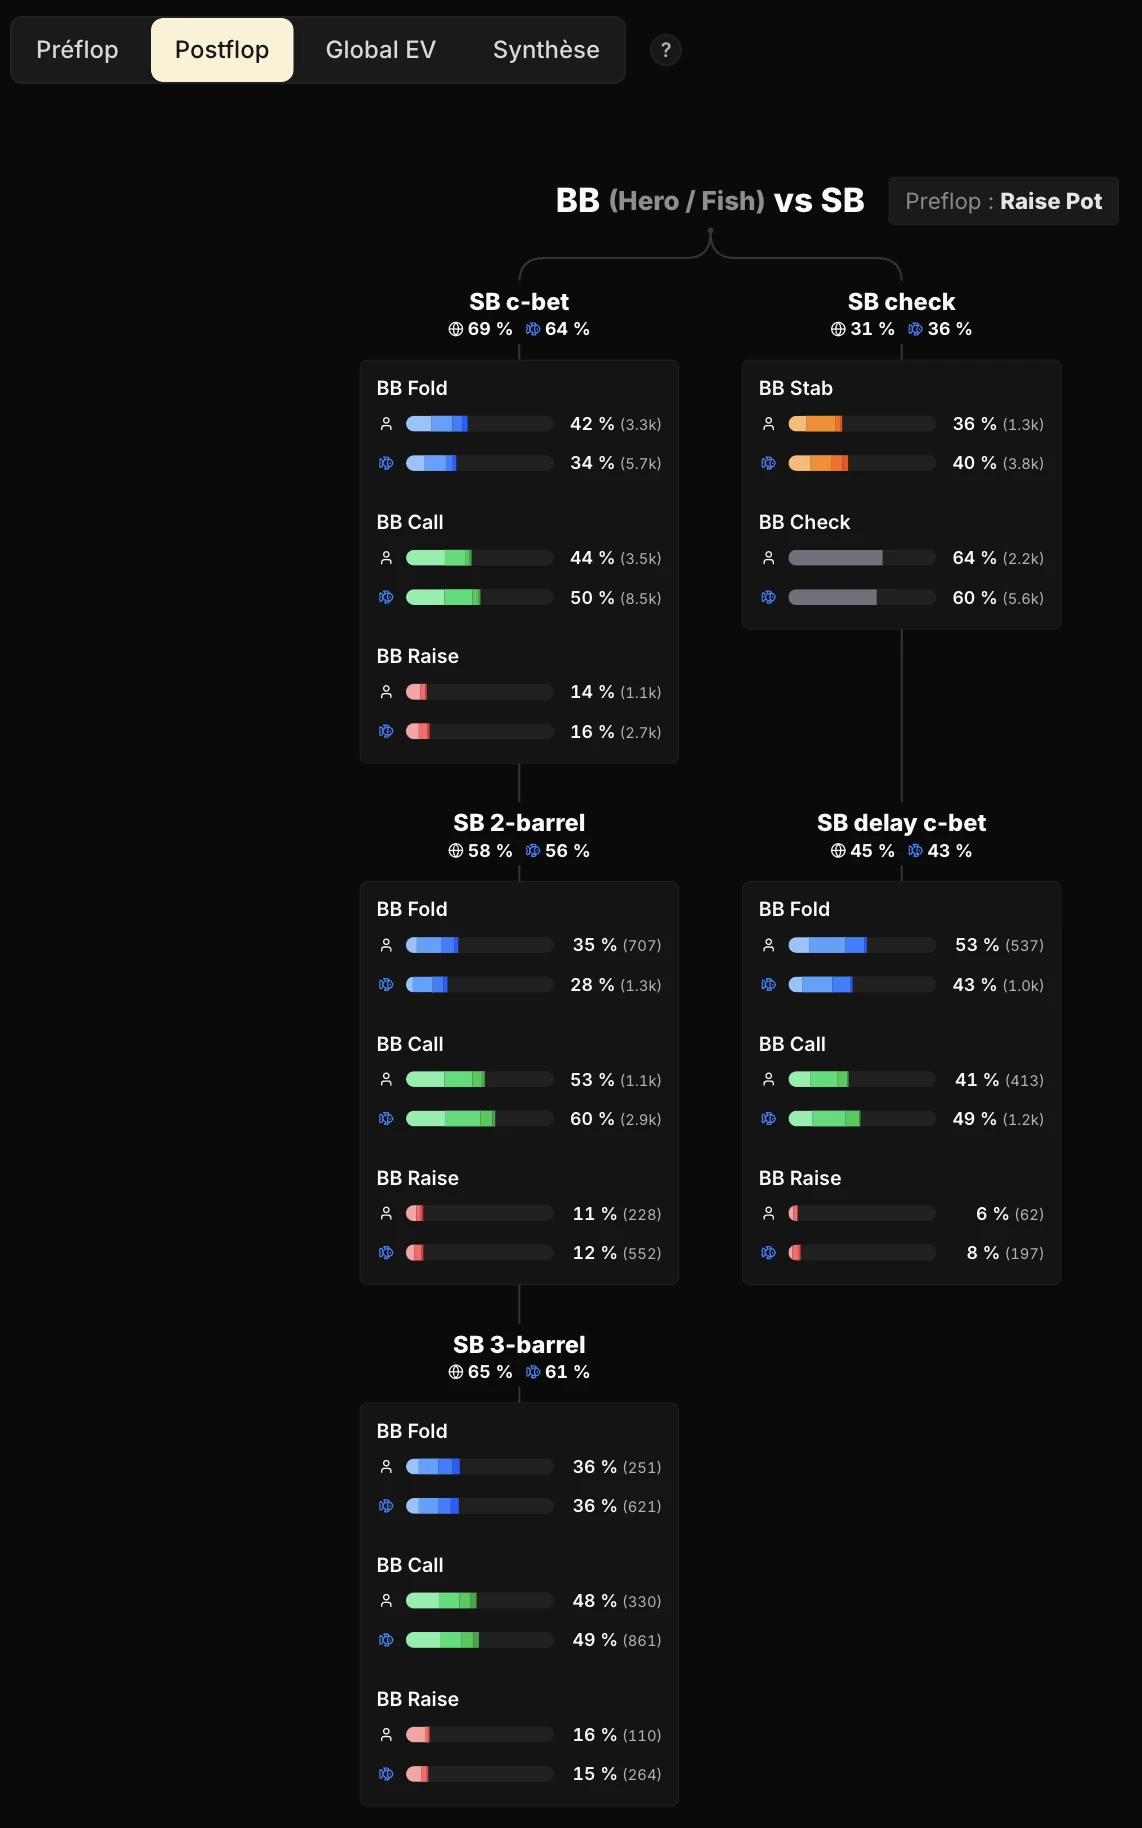
You can then read and compare how each of them plays, action by action.
This comparison opens up two main use cases:
- Finding your own leaks, by comparing yourself to the regs.
- Analyzing your opponents' game (regs and fish), to build exploitative strategies.
Note that this chapter is fairly technical and speaks to intermediate to advanced players. So don't worry if everything isn't crystal clear on the first read.

1. Why compare yourself to the regs
Preflop, the situation is closed. Positions and stacks are fixed, opponent ranges are known (either the player hasn't acted yet and holds 100% of his possible combos, or he has opened and his range is more or less identifiable).
With those clear inputs, a solver produces a well-defined answer: that's exactly what the Poker Sciences charts or your custom charts give you, a clear benchmark to compare your decisions against.
Postflop, the number of variables explodes. A theoretical benchmark does exist for a given preflop construction, but it only holds if you played preflop exactly the way it assumed.
As soon as you deviate for good reasons (pool exploit, simplification, adjustment to a type of opponent), your postflop range no longer looks like the one used to compute that benchmark.
A concrete example
You decide to limp more often than GTO would preflop vs Fish , because they don't isolate enough.
Your limp range gets wider, and you show up on the flop with more trash than the benchmark does.
Comparing your flop c-bet frequency to the GTO benchmark then becomes misleading: that benchmark was computed with a preflop range tighter than yours, so the "right" c-bet frequency is no longer the same.
For a postflop comparison to be truly clean, you'd need a benchmark that adapts to your specific preflop construction.
That's not what we offer today, but it's what is coming to the Study Pack during 2026.
In the meantime, the pool of regs at your stake is the best compass available. You share the same preflop ranges, the same opponents, the same stack constraints.
And if you limp more often than GTO vs Fish , the regs at your stake probably do too: your deviations are roughly the same as theirs, which makes the Hero / Reg comparison relevant.
A practical benchmark, not absolute truth. Regs make mistakes too, and some spots underplayed by an entire pool can stay exploitable.
A gap to the regs is therefore a signal worth digging into, not a verdict. But in practice, those observed differences often turn out to be surprisingly reliable and usually point at the real areas to work on.
2. The two use cases of the Postflop tab
Each situation in the tree can display up to three profiles stacked one below the other (for example Hero / Fish / Reg ), each with its own frequency bar. Same structure, same metrics: you compare your game to two reference groups, the fish and the regs.
Use case 1: finding your leaks
As explained earlier, to find your potential leaks, you get to compare your frequencies (the % next to each action) and your sizings (the color on the horizontal bar, which breaks each action down by bet size) with the regs'.
A clear divergence is a signal: maybe you c-bet too much, too little, or you pick different sizings from theirs.
It's the most direct read, and the one that produces most improvement plans.
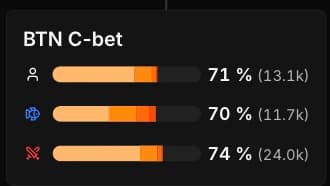
In the example above (the BTN c-bet), the three profiles are within a few points of each other (71%, 70%, 74%): no notable gap, so nothing to report here. But as soon as a clear divergence shows up (you c-bet far less, or noticeably bigger), that's the signal to dig into.
Use case 2: analyzing your opponents' game
Beyond your own game, you can explore the fish's and the regs' game in detail.
The read works on two levels: first the frequencies we've just seen (how often each population takes each action, and with which sizings), then the range composition, which we're about to look at just below.
By clicking an action (c-bet, check, donk bet, etc.) or a sizing inside an action (Small, Medium, Large, Overbet for a c-bet, say), the Hand strength panel appears over the tree: it breaks the matching range down by hand strength category, for every displayed profile at once.
That's how you answer precise questions:
Which combos do the fish donk bet with?
What do they call river with vs a 3-barrel?
What does their check-raise range look like?
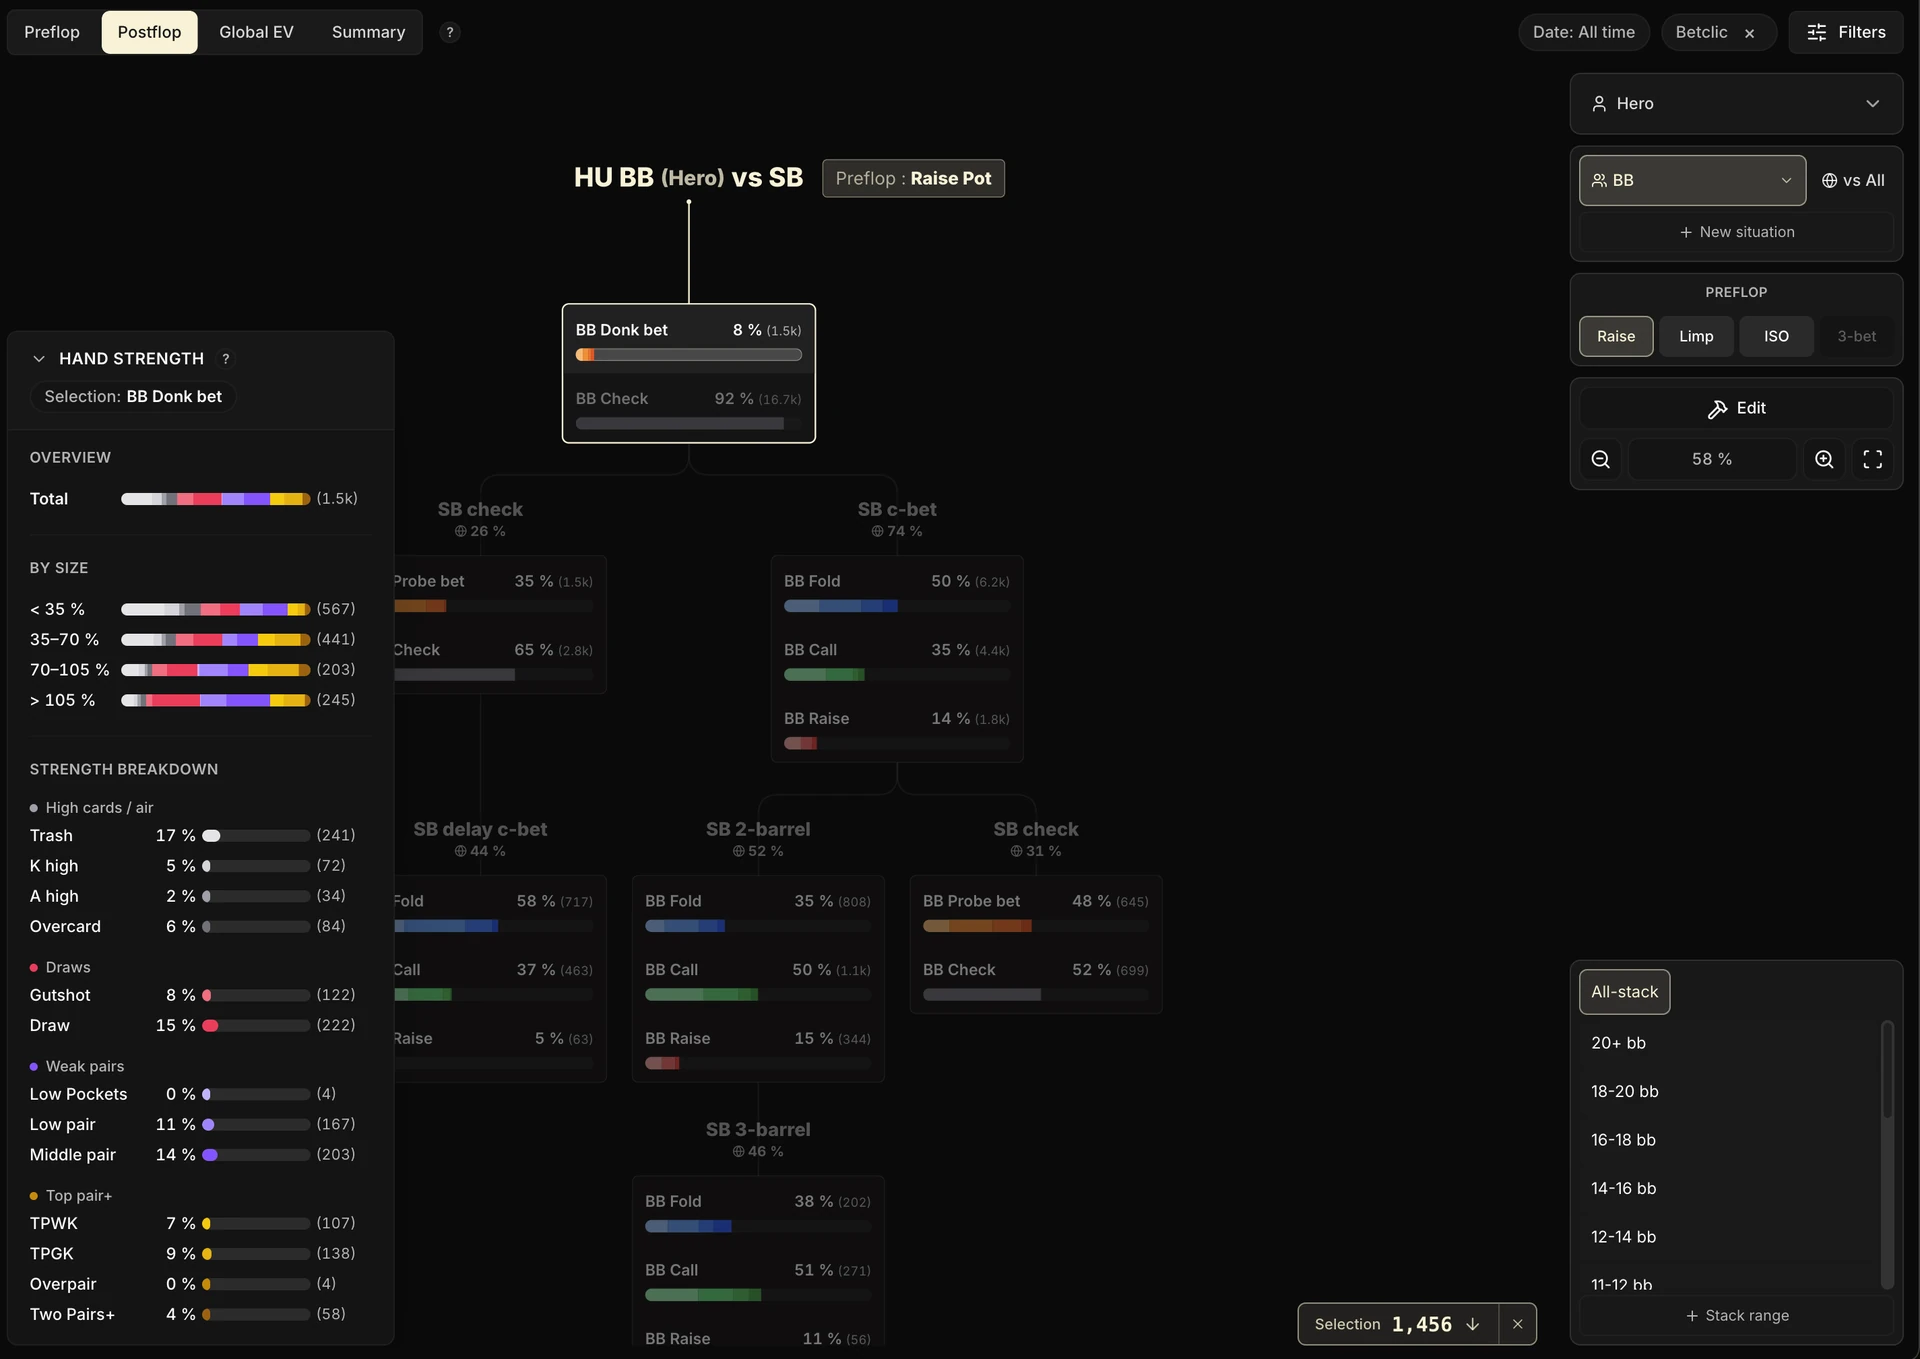
That's where exploitative strategies get built. For example, if the fish mostly donk bet TP, your call becomes less profitable with A high.
Another example: if their check-raises contain 0% bluffs, you can fold wide until proven otherwise.
The Postflop tab doesn't decide for you, but it gives you the raw material to decide.
For both use cases, observing and forming hypotheses is easy: you see a gap, you spot a pattern, you build an intuition.
Turning observation into concrete action (fixing a leak in depth or building a clean exploitative strategy) takes more work.
If you don't have solid postflop fundamentals yet to read those gaps clearly, use this tab mainly as an observation tool to spot the big trends and start building your postflop landmarks.
3. What is measured, and how to get to it
The previous section introduced the Hero / Fish / Reg comparison. We can now look at how to navigate the Postflop tab and understand what each zone is for.
We'll also come back to several points only touched on above, to explore them in more detail.
A. Pick a context, then navigate the tree
Navigation happens in two steps.
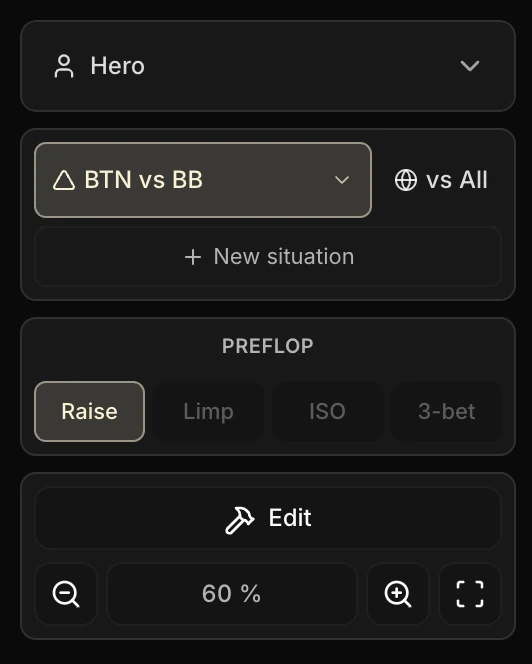
In the sidebar, you first pick a context: the format and the position (for example Hero on the BTN against BB in 3-max ), then the preflop pot type: Raise, Limp, ISO or 3-bet.
The decision tree then displays every situation of that context at once: each branch carries the opponent action that leads to it (check, bet, check-raise, donk...), and each situation shows your profiles' frequencies. Click a situation in the tree to select it.
A small reading bonus: each branch of the tree also displays the frequency at which the opponent takes the action that leads to it. At a glance you can see which paths are taken the most, profile by profile.
Two practical points:
- Defensive situations (facing a c-bet, a check-raise, a donk...): the sizing faced is picked directly in the tree, by clicking the color you want on your defense bar (Fold, Call or Raise).
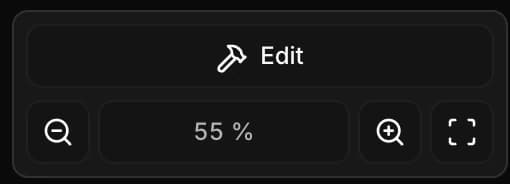
- Tree controls (in the sidebar): zoom in, zoom out, fit the tree to the screen. The Edit button switches the tree into rearrange mode (move situations around, adjust sizings); as soon as a manual layout exists, a Reset button appears to go back to the automatic layout.
B. The three levels of information
For each selected situation, the tab gives access to three levels of information that complement each other, for every displayed profile (Hero / Fish / Reg ).
1. Action frequencies, directly on the tree: for each situation, one bar per profile, with their sizing.
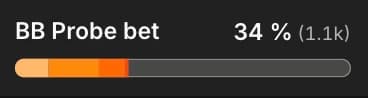
Hovering a bar shows you the frequency breakdown by sizing: Small, Medium, Large, Overbet.
Whenever "vs" is shown, it's always the villain's sizing. Otherwise, it's your own sizing.
And if the sizings on offer don't suit you, the + Sizing button (in Edit mode) lets you customize them situation by situation (bet, raise, vs bet, vs raise sizings).
2. Range composition: with what hand strength Hero, the fish or the regs take the selected action.
By clicking an action or a sizing, the Hand strength panel (which opens over the tree, collapsible via its chevron) breaks down the matching range: an Overview (the overall composition in a single bar), a By size read, and a Strength breakdown sorted into four families (Top pair+, Weak pairs, Draws and High cards / air), each subdivided (TPGK, TPWK, middle pair, draw, gutshot, trash...).
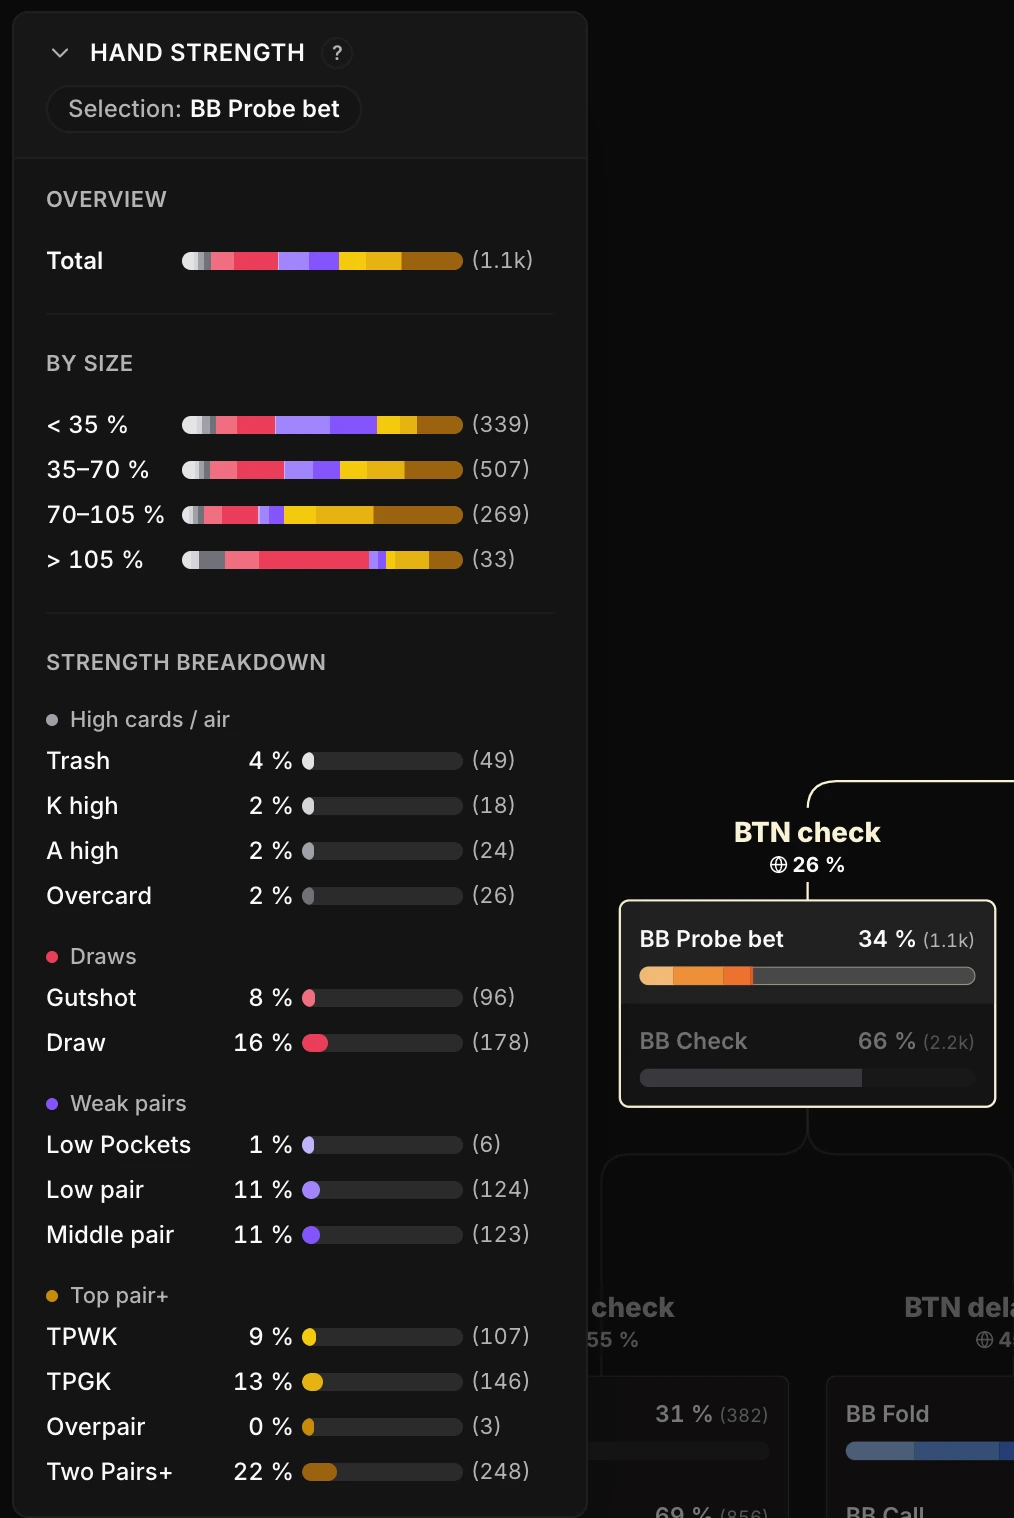
For Hero, all your hands are known. For Fish and Reg, however, only the hands revealed at showdown can be analyzed.
Opponent strength categories are therefore partly biased: they don't represent an exact range, but the hands the opponent showed after taking that line.
The right way to read this is mainly to use that data as comparative clues, especially between Fish and Reg, and to stay cautious when comparing Hero directly to opponents.
3. The hand list, displayed under the tree: it lists the actual hands matching the action (and the sizing, if any) you selected, with date, cards, board, action line and EV.
Clicking a hand opens it in the Replayer.
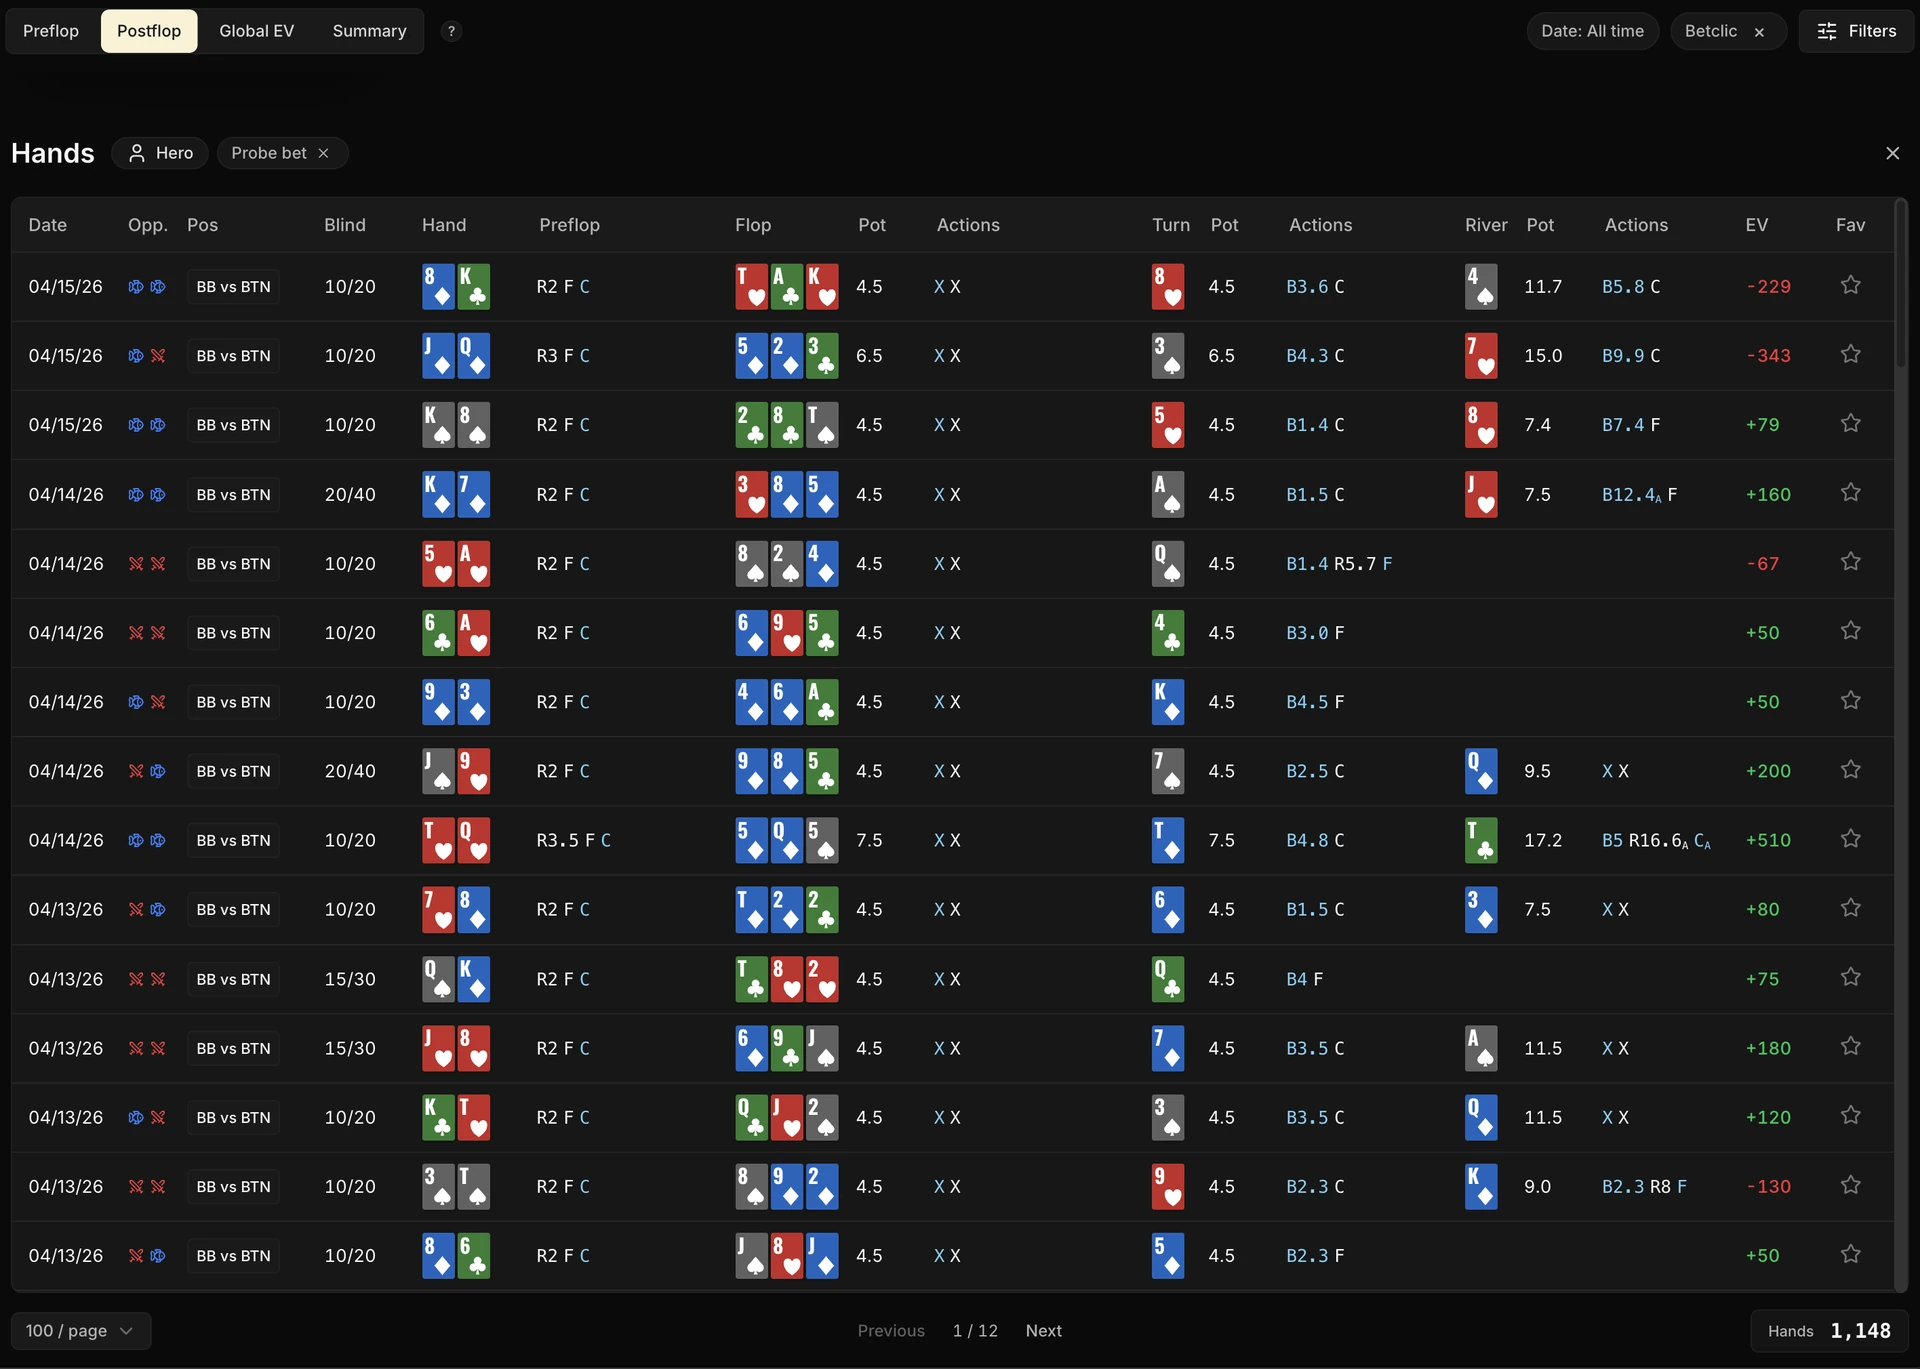
You can narrow the situation down step by step: a click on an action, then on a sizing, then on a hand strength category. With each click, the selection tightens, and the hand list below updates the matching hands.
Concretely, by clicking c-bet, then the Large sizing, then trash for the Hero profile, you see exactly the times when you c-bet your trash with a Large sizing.
C. Choosing the profiles compared, and the vs filter
By default, the tree only displays Hero. As in the Preflop tab, the profile bar at the top of the sidebar lets you add more: up to three profiles in total, among Hero, your tags (Fish , Reg or any custom tag) and even one specific player.
The sidebar's vs filter, on the other hand, restricts the spots by the opponent faced: vs All, vs Fish, vs Reg, vs a tag or vs a player.
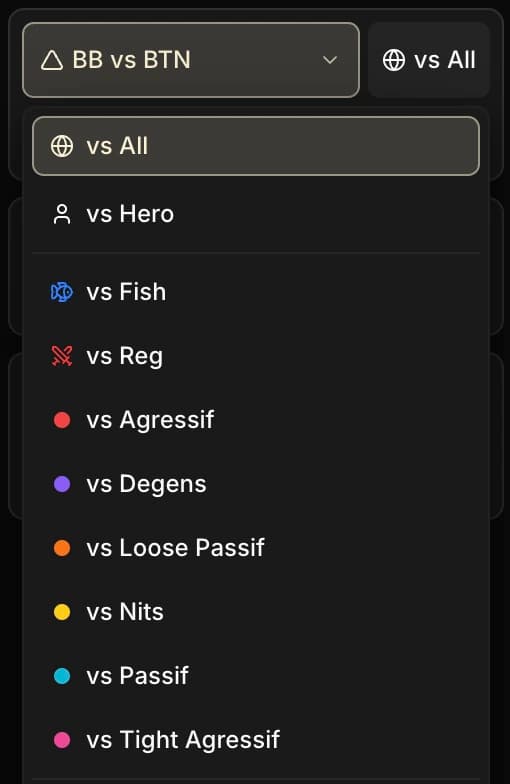
This filter applies to all profiles at the same time. If you pick vs Fish, the Hero bar only shows your hands played against a fish, and the Regs bar the hands where the regs played against a fish.
If you pick vs Reg, in the same way, every profile switches to the spots played against a reg, and you count as a reg yourself: the hands where a fish (or another reg) faced you are therefore included.
D. Going further: custom situations and boards
Three customization tools round out the tab:
- New situation (in the sidebar): a wizard to create your own postflop situations. You build the preflop sequence, advance the postflop sequence up to hero's turn, name the situation, and it shows up in the tree like the others. This action line is built like the Review filter of the same name, covered in the chapter The Filters panel.
- + Sizing (in Edit mode): the sizings of each action are fully customizable, situation by situation.
- The Boards filter (in the Filters panel, at the top of the page) restricts the whole analysis to board textures: flop and turn presets that you create and edit freely (paired boards, monotone, flop height...).
4. The Summary view: your gaps in one table
Reviewing every situation one by one would take forever. That's the job of the Summary view, the first entry in the sidebar, right above the list of situations: it condenses all your postflop gaps into a single table, fed live by your filters.
You're getting used to it by now: the Summary view is there in the Preflop and Postflop tabs, as well as in Global EV and Overview, which we'll see in the next two chapters.
The table starts with a Total row, then displays one row per situation:
- Position and Action: the situation in question (for example HU SB, 2-barrel).
- Hands: your volume on that situation.
- The Frequency group: your action frequency (Hero), compared to that of the Regs and the Fish .
- The Sizing group: your average sizing, compared the same way.
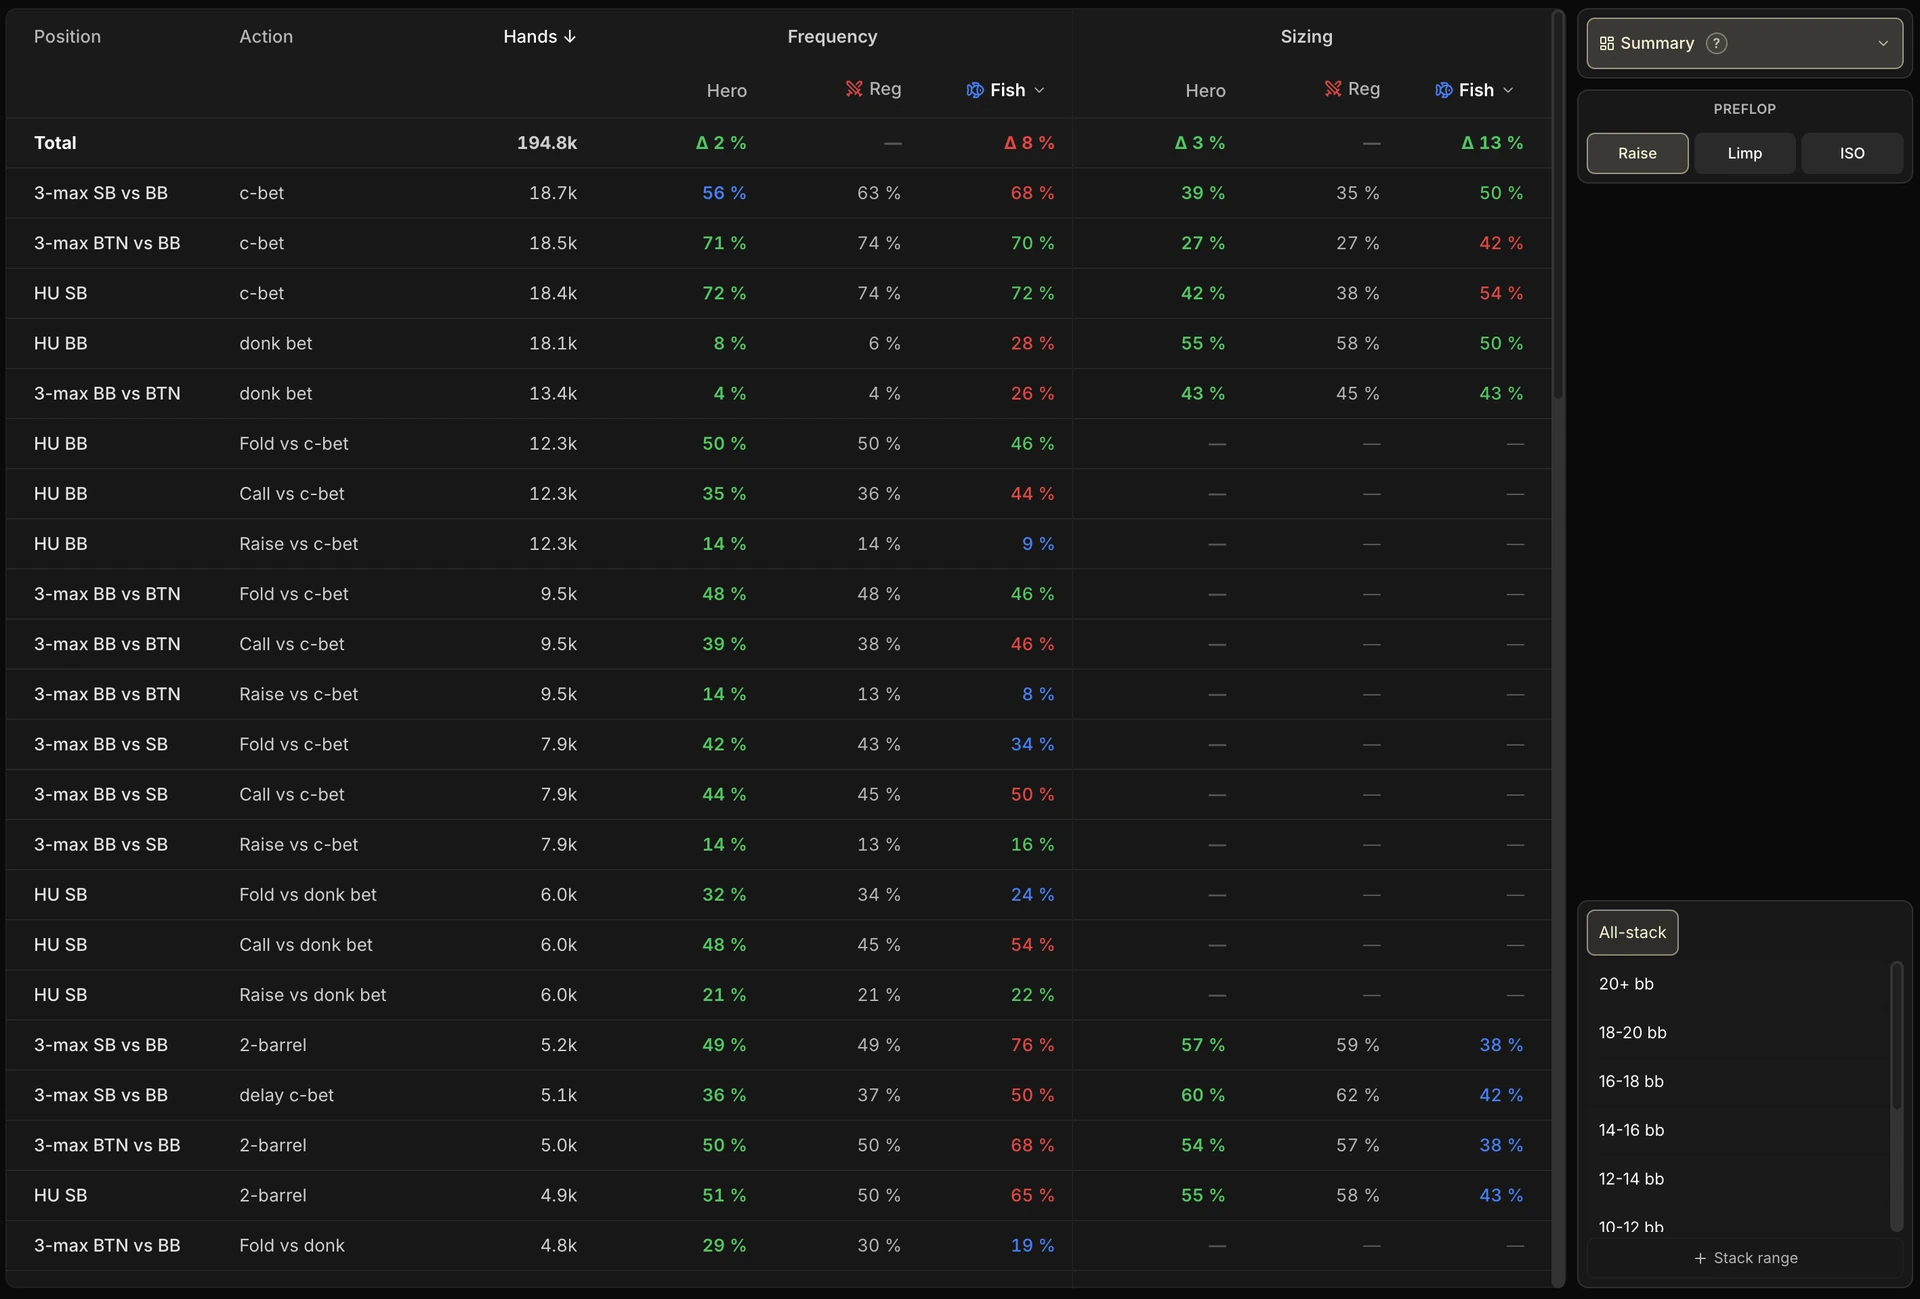
First thing not to miss: the table only shows one pot type at a time. The sidebar selector lets you switch between Raise, Limp and ISO.
Don't forget it! If you always stay on limped pots, you'll never see your Raise or ISO situations.
Reading the colors
The color is always read relative to the Regs, the benchmark. Hero and the comparison column (Fish by default) are colored according to their gap to the Regs:
- Green: reasonable gap (within ±5 points on frequency, ±15 points on sizing).
- Blue: below the Regs (less aggressive, smaller sizing).
- Red: above the Regs (more aggressive, bigger sizing).
Only the Reg column stays neutral: it's the benchmark, it's never colored.
Careful with small samples. When a reference cohort has fewer than 30 occurrences on a situation, its value is replaced by a discreet "< 30": the numbers are too volatile to be shown. And if the Reg benchmark is under that threshold, your Hero value isn't colored at all.
A small bonus: the Fish column header is a dropdown. You can swap in any of your opponent tags to compare your stats to that population. The Reg column, on the other hand, is locked.
A concrete example

On this 2-barrel row, Hero is in line with the Regs: his frequency (51% against 50%) and his sizing (55% against 58%) both come out green. Nothing to report on his side.
It's the Fish who stand out: they 2-barrel far more often than the pool (65%, in red) and smaller (43%, in blue). An exploitable read (their 2-barrel range is wider, probably weaker) rather than a Hero leak.
The Summary view is there to spot at a glance the situations that deserve to be studied: those whose Hero value is red or blue.
Once the situation is identified, click its row: the tab switches straight to that situation, pre-selected in the tree, where you can dig in with the Hand strength panel and the hand list, as seen in the previous sections.
Keeping a critical eye
As we've already said, lining up with the Regs is a good baseline strategy. But it isn't absolute truth: in some spots, breaking away from the herd is exactly what you should do.
The Summary view tells you where you differ, not always where you're wrong.
5. Before you conclude
Like all stats, you have to analyze your data carefully. And postflop, one reflex matters more than all the others: always trace things back to preflop before concluding anything.
A postflop stat is the result of a chain of decisions that starts preflop: your flop c-bet conditions your turn range, which conditions your 2-barrel, which conditions your river range, and so on.
A divergence on a late street can reveal a leak on that street itself, but it can also be the mechanical consequence of an upstream leak.
Example
Your turn 2-barrel sits at 40% while the regs are at 55%. Hasty conclusion:
I give up too often on the turn.
In reality, if you c-bet the flop at 90% while the regs c-bet 70%, your turn range is saturated with weak hands that have no reason to continue. A 2-barrel at 40% becomes mechanically logical.
If there really is a leak, it's on the flop, not on the turn. You plug a leak at the source, not at the outlet.
Provided it really is a leak: maybe you have good reasons to c-bet 90% (pool exploit, simplification), in which case there's nothing to fix.
And of course, check the sample. The more hands you have on a given action, the more reliable the number.
An 80% frequency computed on 18 hands isn't a frequency, it's noise.

Come on, off you go! Tour's over!
By the way... dear Mage... you wouldn't happen to have any information about the Bible of the Game, which they say has been found in the North?
6. Key takeaways
Alright, a fairly technical chapter, I hope I didn't lose you. And if I did, take your time before moving on, because the next one will probably be just as technical.
Put in the volume, play around with the tool and you'll see it's actually pretty easy to get the hang of. You'll quickly pull some very interesting information out of it, about your game and about your opponents'.
Key takeaways
The Postflop tab stacks Hero, Regs and Fish to compare action frequencies, sizings and range composition.
The Summary view (first entry in the sidebar) condenses all your gaps into one table and tells you where to start: the red or blue rows.
Use it to spot your gaps with the regs, then click into the tree and the Hand strength panel to understand which hands hide behind a stat.
You can also explore the fish's game to build exploitative adjustments, but keep two reflexes in particular: check that the sample is big enough and trace back to preflop before concluding.
With the Postflop tab, you now have the tool to understand how you and the pool play each situation.
In the next chapter, we take on the Global EV tab, really the big one in the Leak Finder: another angle, which shows where your EV is built and where it is lost.

When the mage and his apprentice heard Master Valrand asking for information about the Bible of the Game, they were stunned.
So this letter received at the Academy, claiming that the Bible had been found in the North, wasn't some stupid trap after all?
Could the Bible of the Game truly have resurfaced?