The Analysis tab
The whole Leak Finder on a single page. To know where to start.

Gandalf
Co-founder of Poker Sciences

We just covered the first three tabs of the Leak Finder. The Analysis tab completes this set by automatically aggregating their data to point out the areas where you win or lose the most.
Concretely, the Analysis tab gives you an automatic synthesis in four panels: a Preflop panel, a Postflop panel, then two Global EV vs GTO panels.
These last two reuse the Compare to GTO mode of the Global EV tab: the first measures the gaps in bb/hand, the second in chips/hand.
The result fits on a single page and tells you where to start working.
Note: this tab will keep evolving. Several improvements are already in the works to make it an even more powerful tool in upcoming versions.
1. How the analysis works
The analysis is not computed continuously.
It is triggered on demand, by clicking the Analyze my data button in the center of the tab.
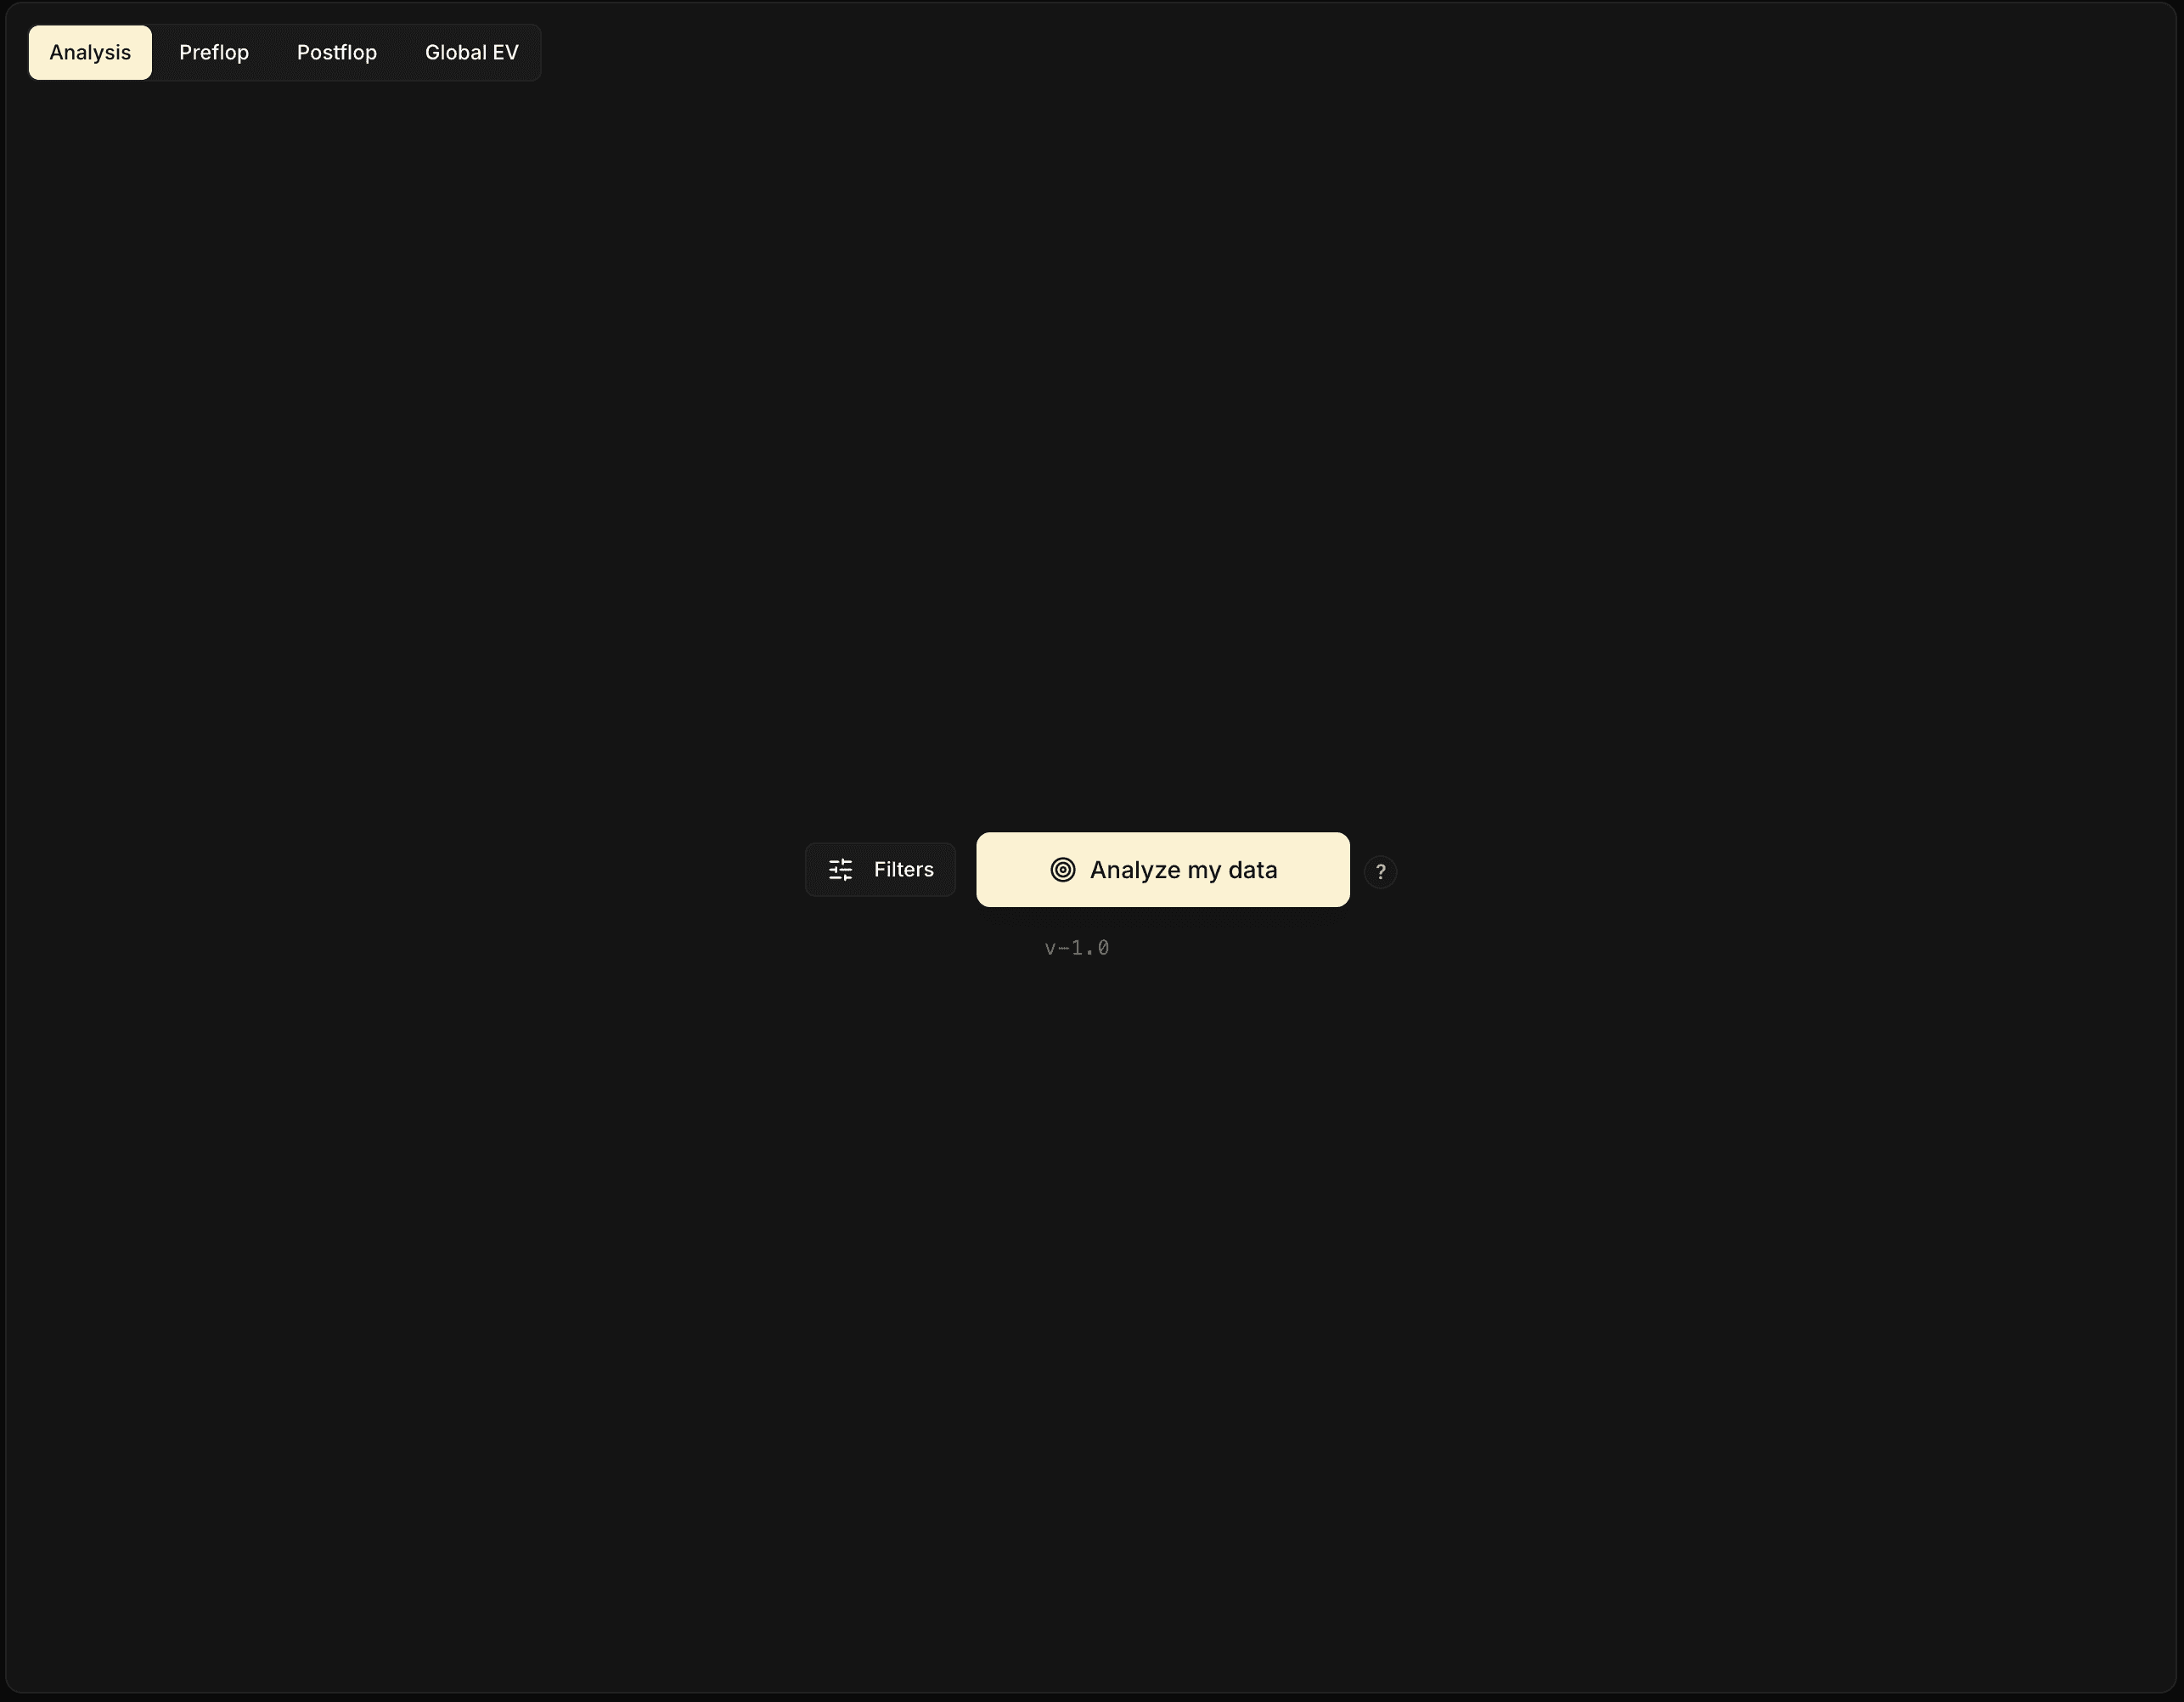
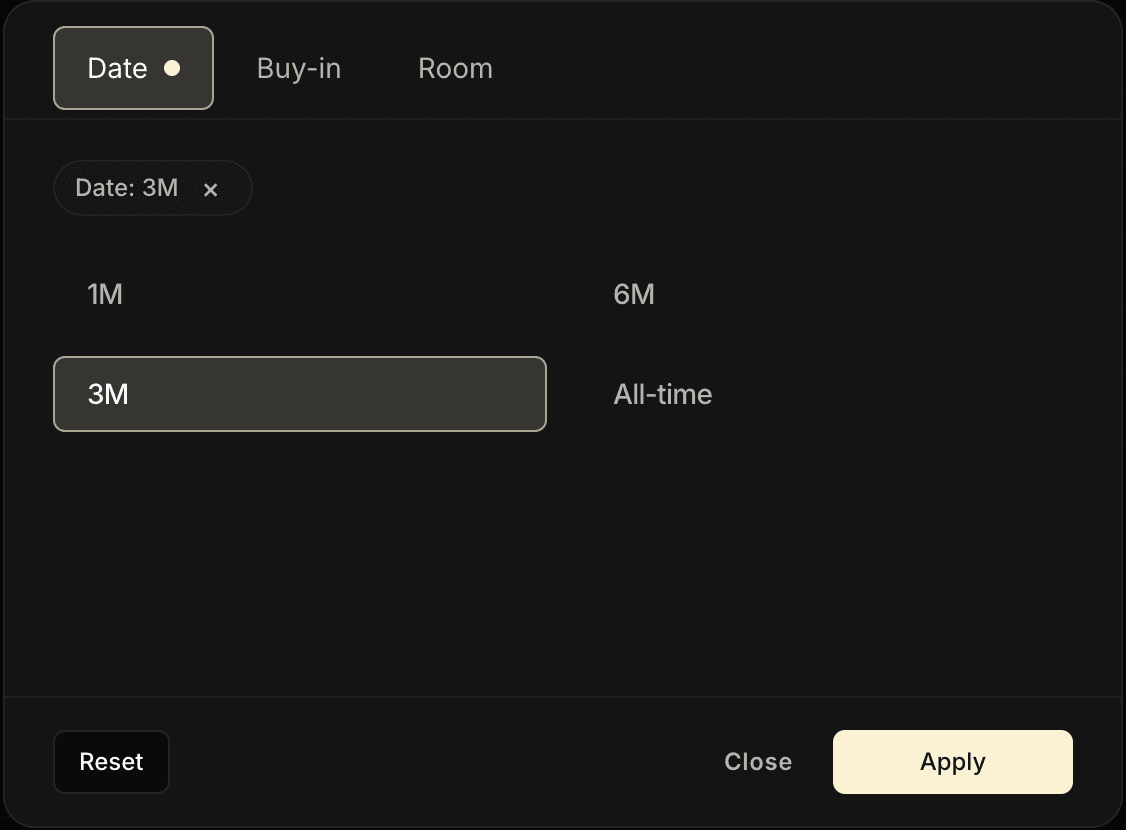
The analyzed sample is defined by the date, room and buy-in filters located next to the Analyze my data button, before the click.
For example, to analyze your last 3 months, select the 3M period first.
The interface
Four panels in a 2 by 2 grid:
- Top left: Preflop.
- Top right: Postflop.
- Bottom left: Global EV vs GTO.
- Bottom right: Chips EV vs GTO.
Now that you've seen the structure of the Analysis tab, let's go through each panel one by one.
2. The Preflop panel
For preflop, nothing too complicated.
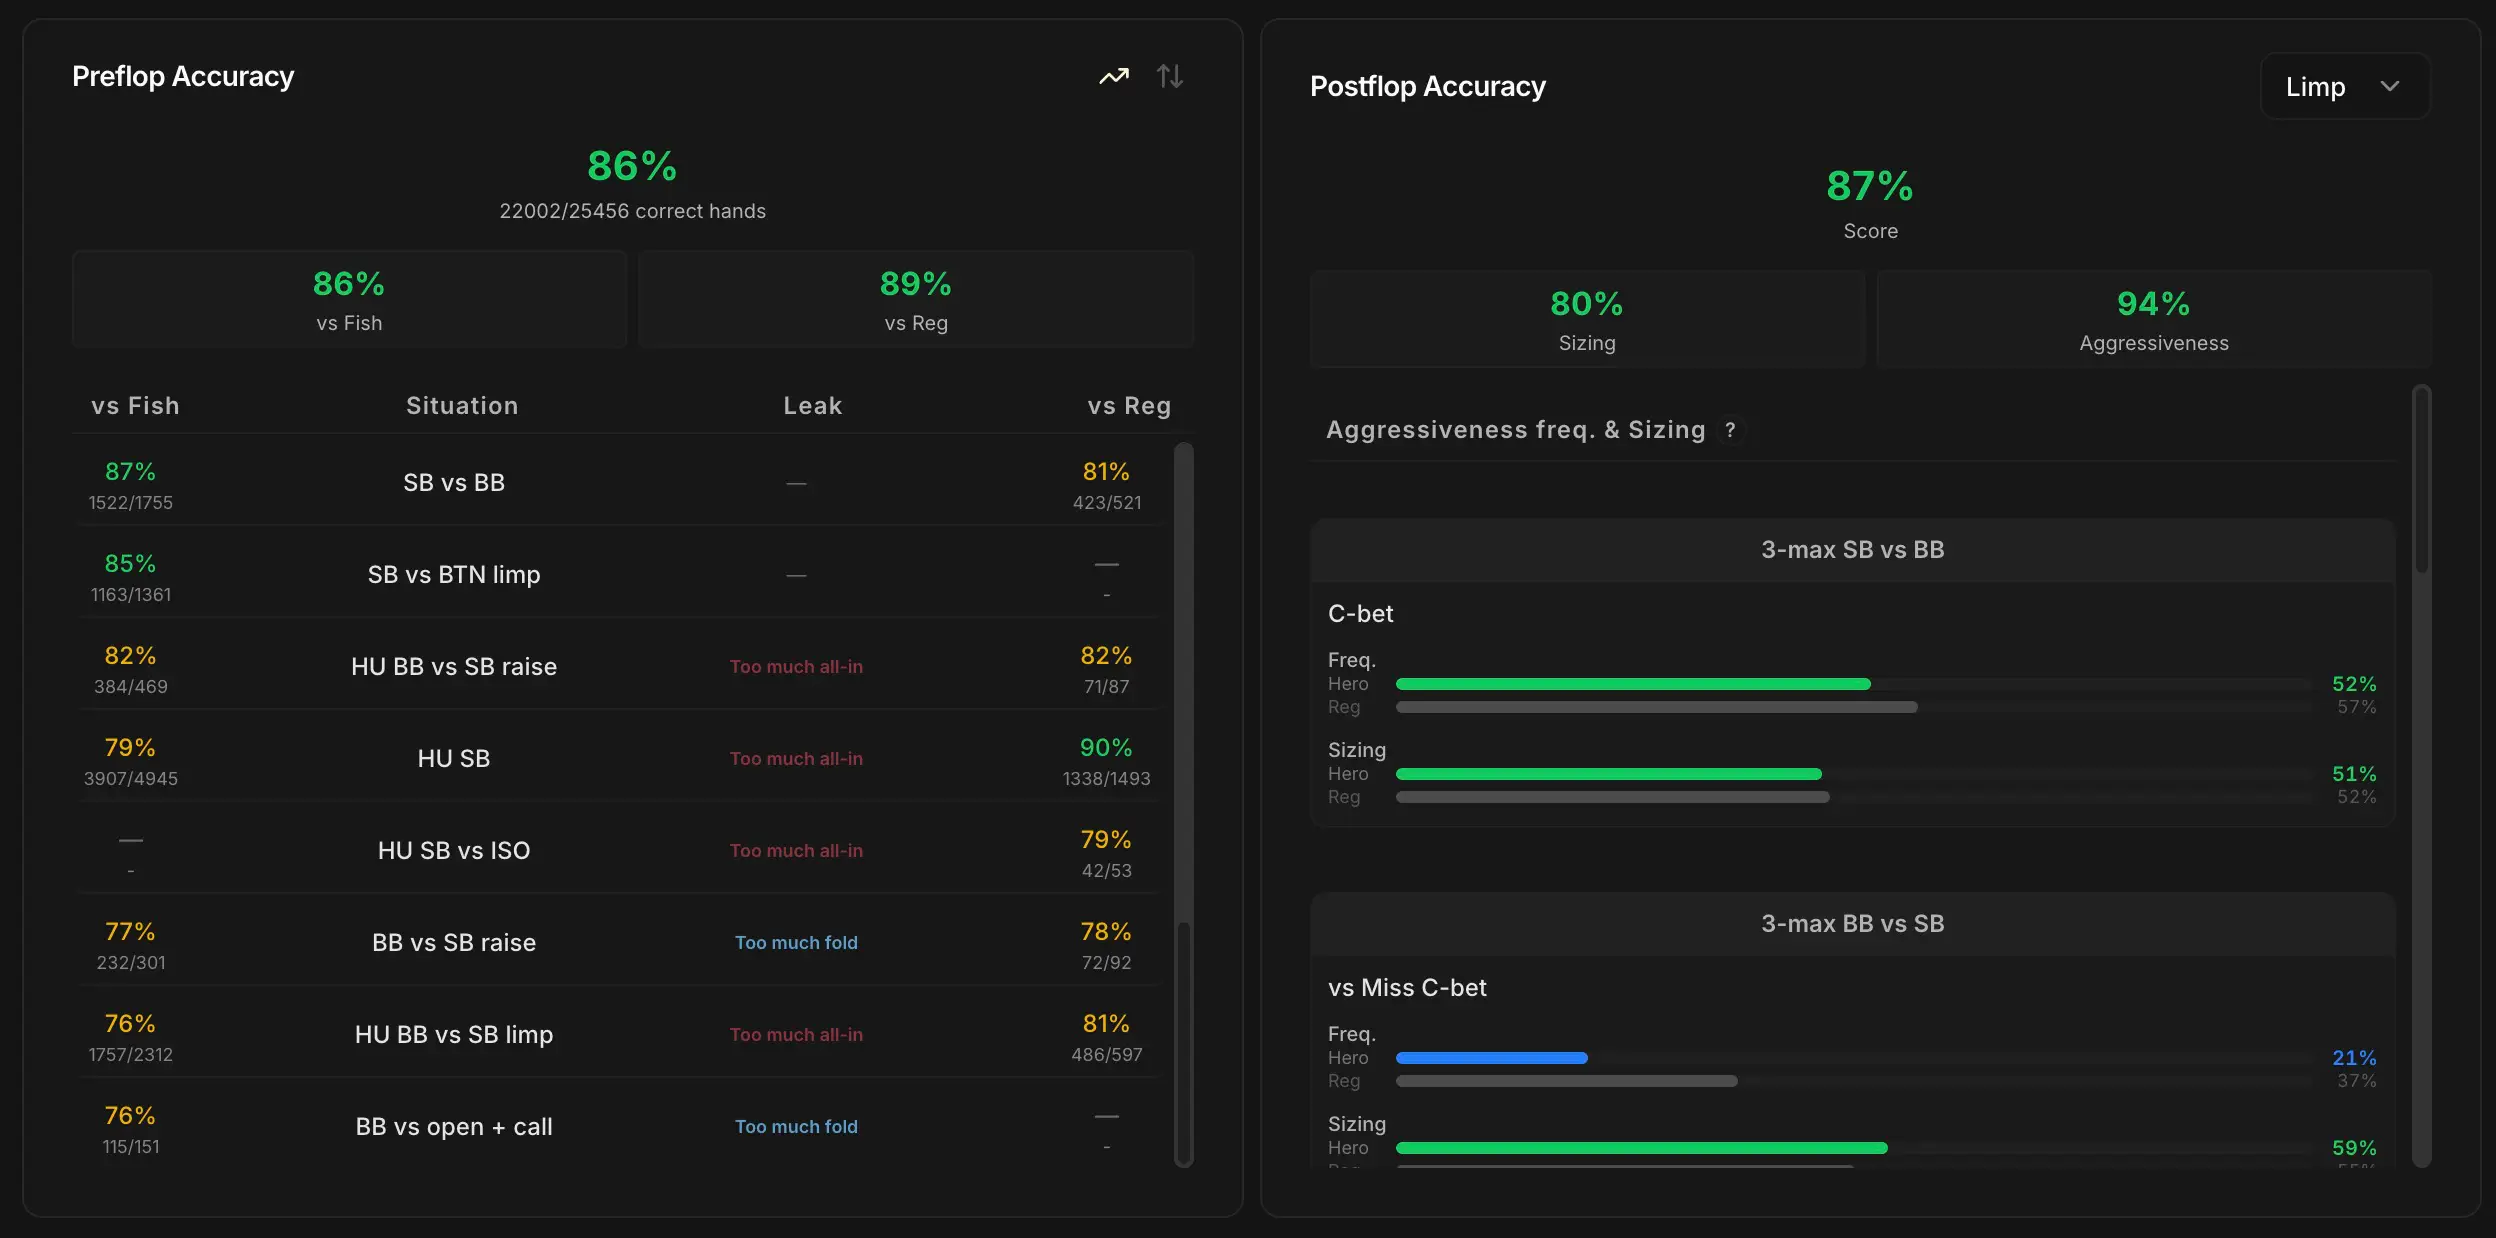
The panel gives you your preflop accuracy for each supported situation, broken down vs Reg and vs Fish.
This way, at a glance, you see in which positions you drift away from the reference Charts you have configured: the Poker Sciences Preflop Pack Charts by default, or your custom Charts (see Custom Charts) if you've created any.
Good news: even without buying the Preflop Pack, PRO and MAX players automatically benefit from the Preflop Pack reference Charts for the preflop accuracy calculation in the Analysis tab.
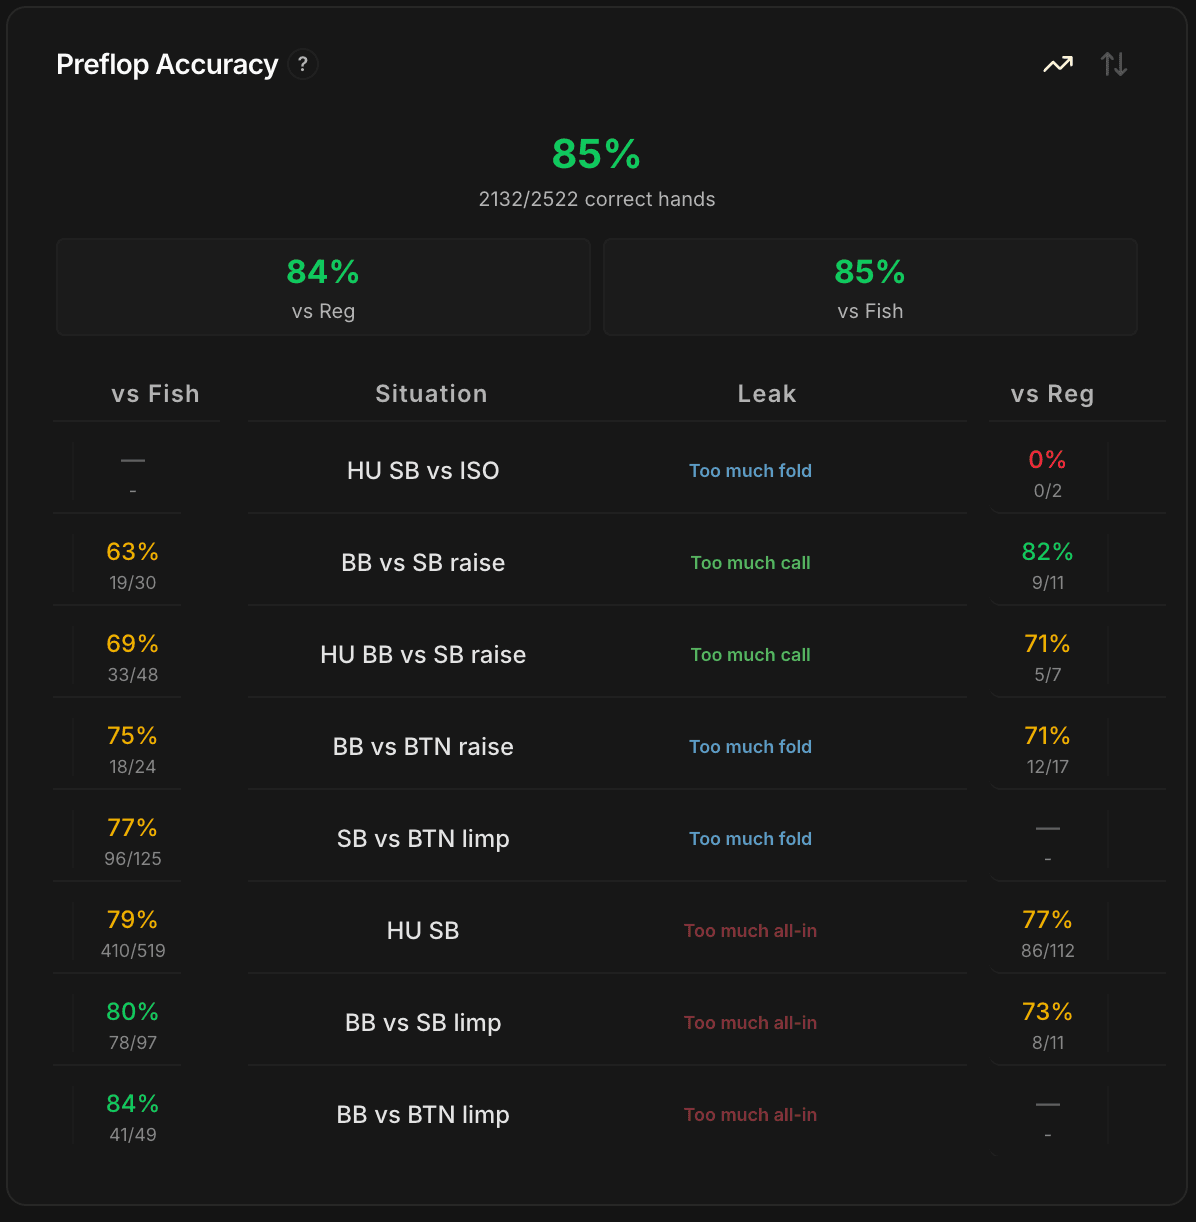
Two buttons at the top right let you sort by accuracy or by hand volume.
The Leak column points to the dominant mistake in each situation: "Too much fold", "Too much call", "Too much all-in".
On the screenshot, two situations would deserve your attention:
- SB vs BTN limp: 77% accuracy on 125 hands against Fish.
- HU SB: 79% accuracy on 519 hands against Fish.
In both cases, accuracy is average and volume is high. These are the ones that weigh the most in your overall result, so that's where you could start.
Use critical thinking: 0% accuracy on 2 occurrences is less worrying than 70% on 1,000 occurrences. Sorting by volume is exactly what lets you filter out this noise.
Aim for 85% accuracy on average. Reaching 100% is illusory: the system compares your decisions to a fixed reference, so some deviations that are relevant in-game will naturally show up as gaps.
Heads up: here all stack sizes are aggregated. The panel doesn't distinguish whether your mistakes come from your range at 12 bb or at 25 bb.
To dig in, click on a row: the tool jumps you straight into the Preflop tab with the situation pre-selected, where you can analyze stack by stack where the mistakes are coming from.
Concretely, this panel is here to help you prioritize your preflop range revisions.
3. The Postflop panel
The second panel is slightly more complex.
It synthesizes your gaps relative to the Regs in the pool, both on your action frequencies and on your sizings, on the postflop situations where the sample is sufficient.
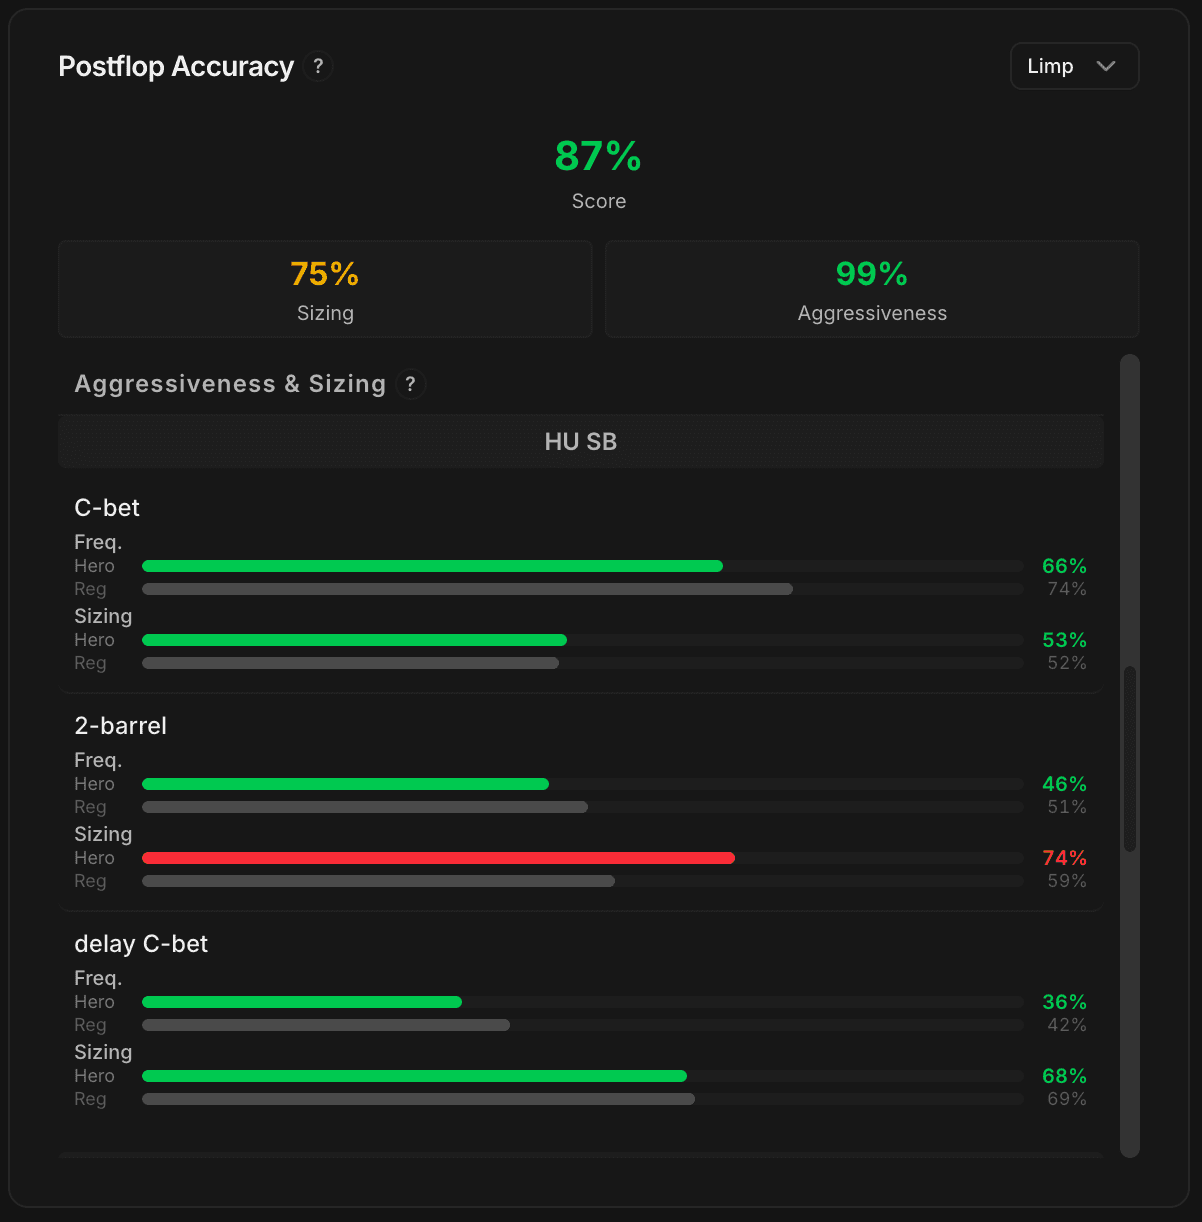
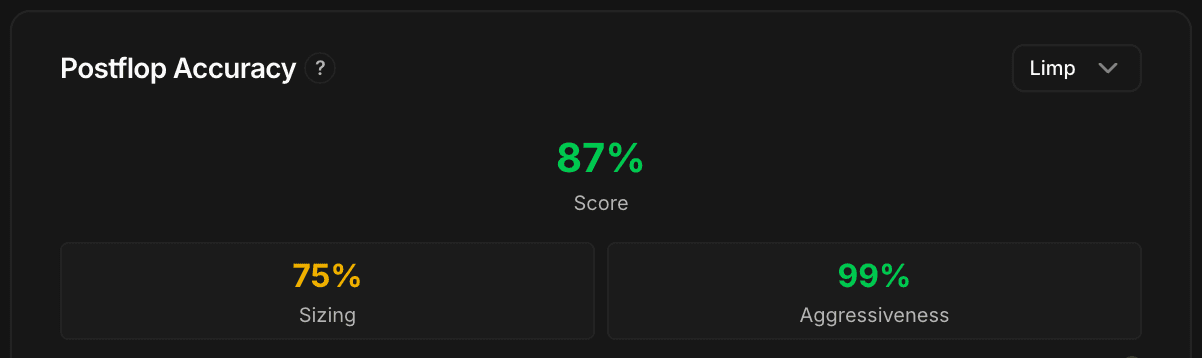
Three scores at the top of the panel
| Score | What it measures |
|---|---|
| Overall score | Synthetic score combining frequencies and sizings, computed as an average per situation. 100 = aligned with the Regs, 0 = very far off. |
| Sizing | Score dedicated to the size of your bets (relative to the average sizing of the Regs). |
| Aggressiveness | Score dedicated to your aggression frequencies (relative to the frequencies of the Regs). |
These three scores are an overall snapshot: are your postflop frequencies and sizings holding up, yes or no.
As always, it's a vs Regs comparison: depending on your level and your stake, aiming for a perfect score is not at all the goal.
The Regs make mistakes too, especially on sizings. A large gap is a warning sign, not necessarily a leak.
Reading the per-situation detail
First point not to miss: the Pot Type selector at the top right of the panel.
By default, the analysis does not display all situations simultaneously. You have to choose which type of pot you want to analyze: Limp, Raise or ISO.
Don't forget about this! If you always stay on Limp, you'll never see the Raise or ISO situations.
The detail is then grouped by position. For each displayed situation, two comparison bars:
- Frequency: your action frequency vs the average frequency of the Regs.
- Sizing: your average sizing (in % of pot) vs the average sizing of the Regs.
Color code for your Hero bar, depending on the gap with the Regs:
- Green: reasonable gap (between -15 and +15% in frequency, between -10 and +10% in sizing).
- Blue: you are below the Regs (less aggressive, smaller sizing).
- Red: you are above the Regs (more aggressive, bigger sizing).
Minimum filter. A situation only appears if you and the Regs both have at least 60 occurrences on it. Below that, the numbers are too volatile to be displayed.
Concrete example
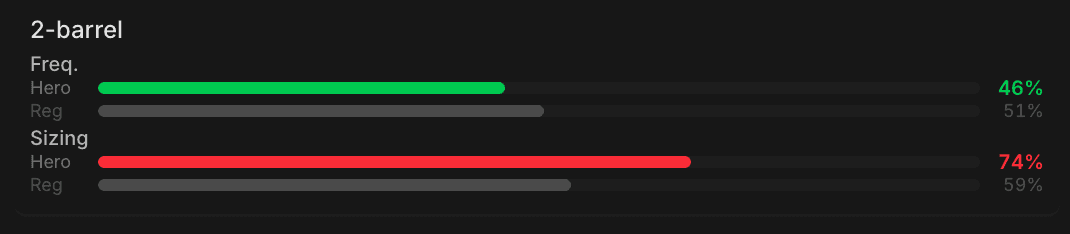
In the screenshot above, for the HU SB limp pot situation, the 2-barrel stands out.
Your 2-barrel frequency (46%) is close to that of the Regs (51%), so nothing abnormal on that side. On the other hand, your average sizing is at 74% of pot vs 59% for the Regs, a gap of +15%.
You bet noticeably bigger than the Regs on average on the 2-barrel: worth digging into to see whether it's a problem in your game or not.
This panel is here to spot at a glance the situations that deserve to be studied: those where a bar is red or blue.
Once the situation is identified, as with preflop, click on the row: the tool jumps you straight into the Postflop tab with the situation pre-selected, where you can dig flop by flop, texture by texture, into what produces the gap seen in the synthesis.
When digging into the detail, don't hesitate to come back to the various points covered in the Postflop tab chapter: they give the keys to interpret the vs Regs gaps without falling into the classic biases.
Keep your critical thinking
As we already said, aligning with the Regs is a good baseline strategy. But it isn't an absolute truth: on certain spots, deviating from the herd is exactly what to do. The Postflop panel tells you where you differ, not always where you are wrong.
4. The Global EV vs GTO and Chips EV vs GTO panels
To wrap up, let's get to the last two panels.
These are probably the most interesting ones in the Analysis tab, but also the trickiest to read.
Both of them rely on the notion of structural EV introduced in the Global EV tab chapter.
As a reminder: each situation has a theoretical equilibrium EV. The BTN is structurally winning (the position is profitable), the SB slightly positive, the BB structurally losing because paying the blind without a choice is mechanically costly.
It's this reference EV per situation that serves as the comparison point for your results.
The Global EV vs GTO panel compares your average EV in bb/hand to the structural GTO EV of each situation.
This way you see whether you're winning (or losing) more than you theoretically should in each position.
The Chips EV vs GTO panel does the same thing, but expressed in chips.
Its particularity: it also displays the expected structural CEV next to your EV gap compared to GTO, which opens up a two-step read. We'll come back to this below.
The calculation, common to both panels
For each of the 7 parent situations (BTN, SB vs BTN, SB vs BB, BB vs BTN, BB vs SB, HU SB, HU BB), each panel computes three values: your average EV, the EV a GTO solver would have obtained on the same sample, and most importantly the difference between the two.
To learn more about the notion of parent situation, you can go re-read the Global EV tab chapter.
Quick read
| Score color | EV difference | Read |
|---|---|---|
| Green (positive) | Your average EV is higher than GTO theoretical EV in this position. | You are over-performing GTO. Meaning you are exploiting the pool. |
| Red (negative) | Your average EV is lower than GTO theoretical EV in this position. | You are under-performing GTO. Leak signal only if the uncertainty (±) is smaller than the value. Otherwise, variance is enough to explain the gap and you need more volume before drawing a conclusion. |
How to read these panels concretely
Next, the panel gives you row by row (that is, situation by situation) the difference between your EV and that of GTO. On the left vs Fish and on the right vs Reg.
For each situation, you first look at whether you are above or below zero.
Then you compare vs Reg (often close to zero, you're playing against players at your level) and vs Fish (generally higher, this is where your exploits should stand out).
The positions where the vs Fish score is very high are those where the Fish make the most mistakes, so situations that are strategically important for you, to maintain and dig into.
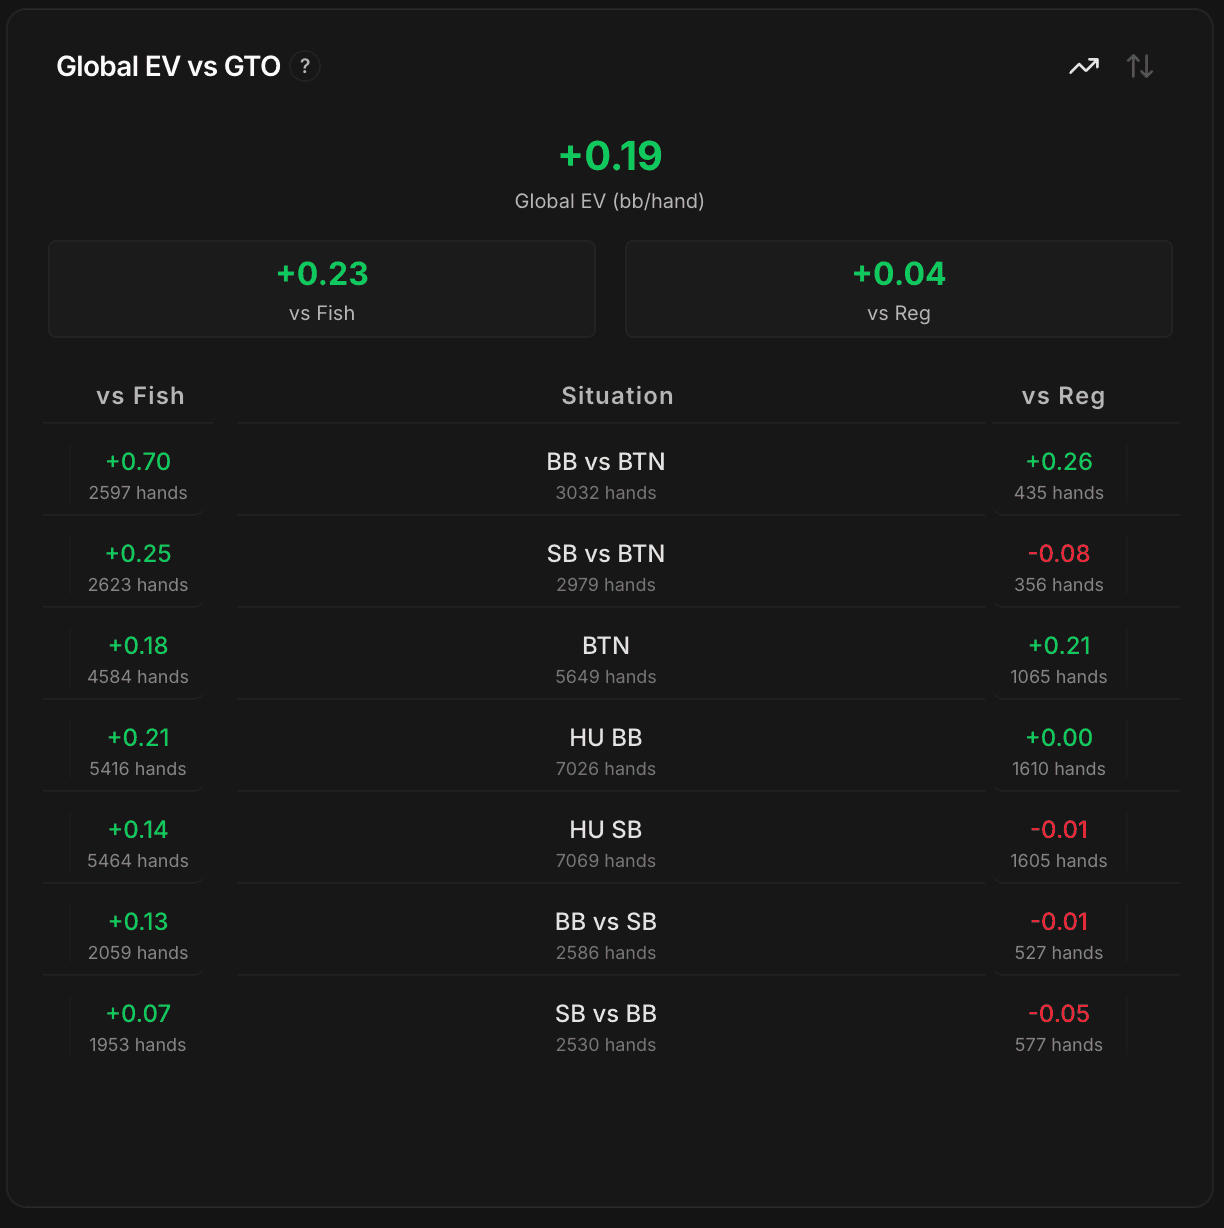
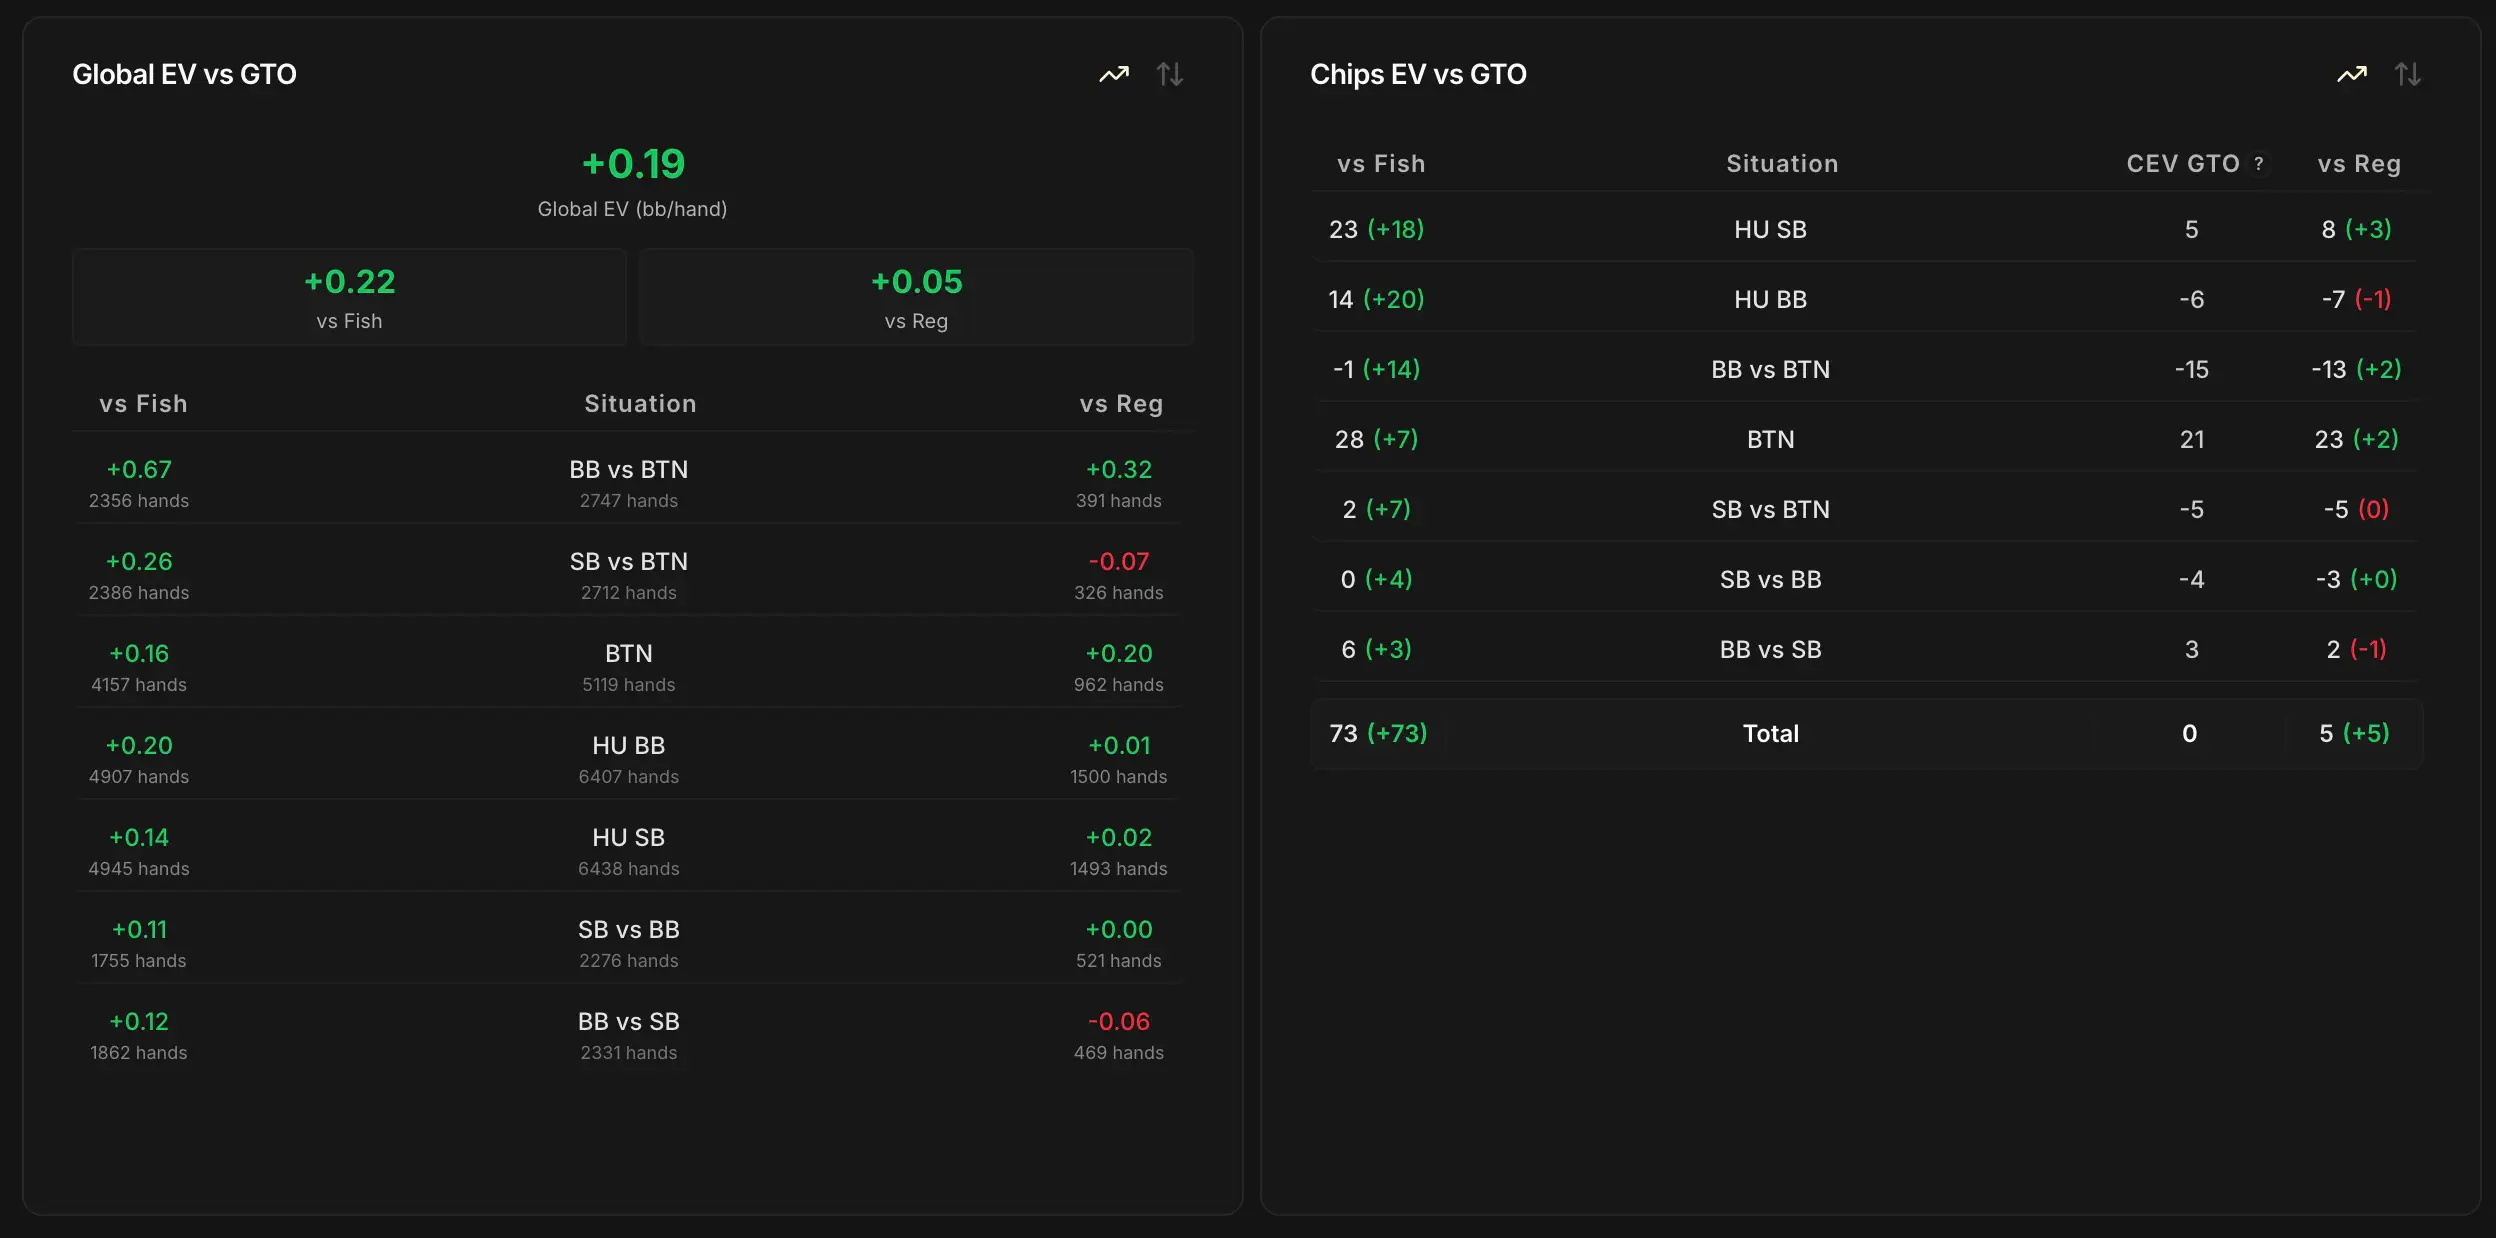
On this screenshot, the average Global EV score is at +0.19 bb/hand. In detail:
- BB vs BTN: +0.70 vs Fish / +0.26 vs Reg over 2,597 hands. A massive exploit vs Fish, clearly the position where the Fish make the most mistakes in this sample.
- BTN: +0.18 vs Fish / +0.21 vs Reg. You exploit both types of opponents.
- HU BB: +0.21 vs Fish over 5,416 hands, +0.00 vs Reg over 1,610 hands. Clear exploit vs Fish, even game with the Regs.
- SB vs BTN: +0.25 vs Fish / -0.08 vs Reg over 356 hands on the Reg side. The red on the Reg side is worth digging into, but 356 hands is little, the uncertainty is probably huge.
- HU SB / BB vs SB: +0.14 and +0.13 vs Fish, -0.01 vs Reg in both cases. On the Reg side, both are very close to zero, more likely variance than a real leak.
What to do with a negative value (in red)?
As soon as a situation displays a negative value in the Global EV vs GTO panel, the Analysis tab alone isn't enough to conclude.
The first step is to jump into the Global EV tab, select the same parent situation on all-stack, and look at the total uncertainty displayed at the bottom of the grid.
If it is larger than the loss, you can't conclude; at best you can formulate hypotheses.
If it is smaller, it's probably a real leak and you can dig into the detail (hands, stacks, dynamics).
Concrete example with SB vs BB
In the Global EV vs GTO panel above, SB vs BB shows -0.05 bb/hand vs Reg over 577 hands: a negative value in red, a potential leak signal.
To decide, we jump into the Global EV tab, select SB vs BB vs Reg on all-stack, and read the KPIs at the bottom of the grid:
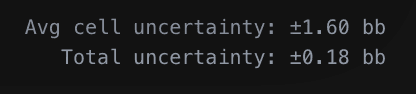
The total uncertainty is ±0.18 bb, which is larger than the 0.05 bb/hand loss flagged by Analysis.
So we can't conclude on a leak: variance is enough to explain the gap. At best, we formulate hypotheses and wait for more volume before deciding.
Very important point
As explained above and in the Global EV chapter, these indicators measure your performance relative to GTO, not your absolute gain.
Example: in BB vs SB, paying the blind without a choice is mechanically costly. GTO therefore loses money in this position.
A positive score (for example +0.22 bb/hand) therefore means that you lose less than GTO, not necessarily that you win chips in this position. But as we said, some positions are structurally losing in the long run, even when they are well played.
Reading the 2nd panel (Chips version)
Before reading the numbers, two things to know.
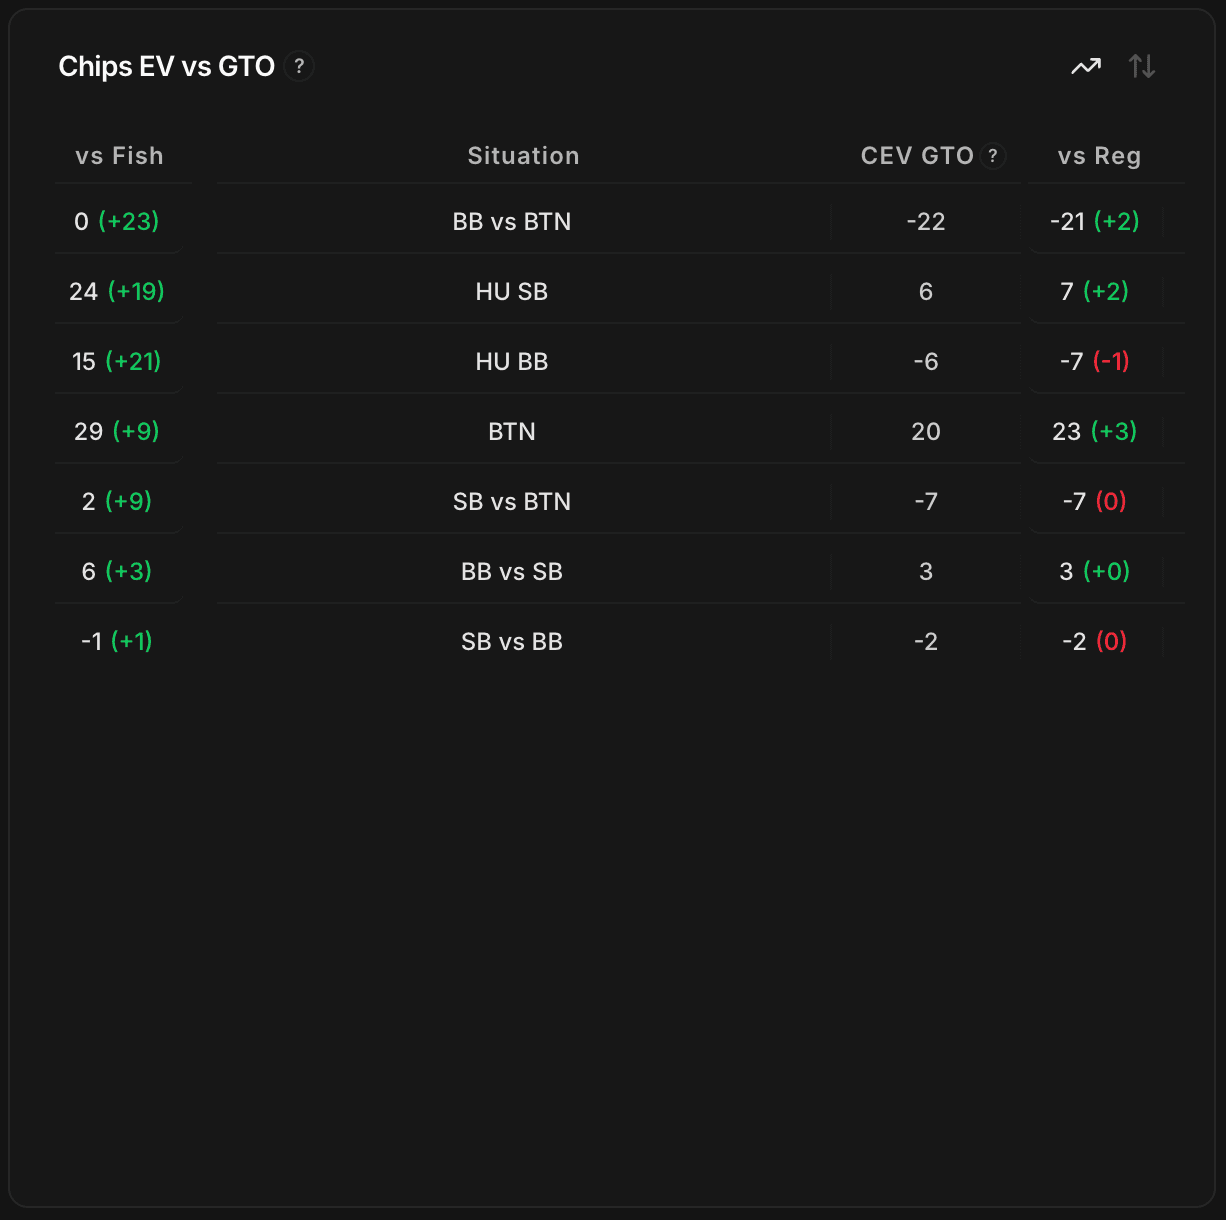
The dedicated GTO CEV column displays the structural CEV of each position: what a GTO solver theoretically obtains (BTN at +20, BB vs BTN at -22, etc.).
And each vs Fish / vs Reg cell shows two numbers: your CEV (average chips won or lost per tournament), then in parentheses your gap relative to GTO.
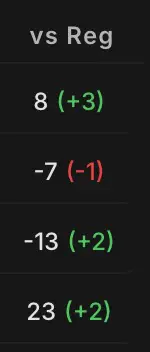
On the BTN row, 23 (+2) vs Reg therefore means that you won 23 chips per tournament against the Regs, which is 2 more than a GTO solver on the same sample.
With these reference points, you can read each cell in two steps: the absolute value tells you your raw result (a value of little use on its own), and the delta (in parentheses) tells you how you're playing compared to GTO (exploit or leak).
Two examples that illustrate the two extremes:
- BTN (structural CEV: 20): 23 vs Reg, 29 vs Fish. You are above the structural CEV on both types: clear exploit on the profitable position.
- BB vs BTN (structural CEV: -22): -21 vs Reg, 0 vs Fish. You still lose chips in absolute terms vs Reg, but slightly less than GTO. Vs Fish, you turn a structurally losing position into near-break-even: a massive exploit.
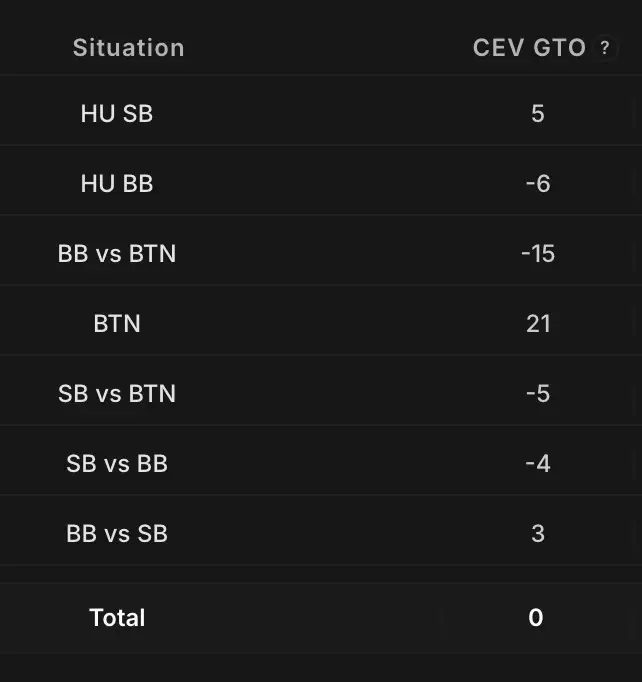
Long-term reference point
Each GTO CEV is *conditional* on the branch actually played: “SB vs BB” and “BB vs SB” (BTN folded, same blind-vs-blind pot) offset each other — but the 7 situations don't all cancel out. Their sum = the structural CEV of the spots you actually face (typically negative: the blinds are unavoidable dead money). Beating GTO means having a positive total delta against that baseline.
5. Key takeaways
The Analysis tab is the automatic synthesis of the three other tabs of the Leak Finder.
In one page, it tells you where to start working, without having to browse Preflop, Postflop and Global EV one by one.
A few practical points to keep in mind:
- The analysis is triggered manually and only uses the filters set next to the Analyze button.
- A click on any row jumps you into the corresponding tab to dig in stack by stack or flop by flop.
- The uncertainty displayed in the Global EV tab is the only way to separate a real leak from a zone that is just variance.
The Analysis tab is the most condensed observation Poker Spin Tracker is able to produce, but strategy is built outside of the tool. And it's here that you'll come back to measure whether your adjustments pay off.
One last note: the Analysis tab is in its first version. Many projects are already in the works to make it an even more powerful tool in upcoming versions.
All in all, we've now covered all the tabs of the Leak Finder. I hope this has all been clear enough, we did our best to make it as pedagogical as possible.
In the next chapter, we leave the tabs behind to talk about method: how to prioritize your leaks, structure your work sessions, and turn an analysis into measurable progress.