The Preflop tab
Visualize your ranges and the pool's, compare them to a reference strategy, set the table format and opponent profile, and use what you see to build exploit strategies.

Gandalf
Co-founder of Poker Sciences
Welcome to the first tab of the Leak Finder, the Preflop tab. As the name suggests, this is where you can easily visualize your preflop ranges (and your opponents') on a 13×13 grid.
If you have the Preflop Pack, you can also compare your ranges in one click to our Charts or to your custom Charts, to spot any deviations.
And you can do this at any stack size, in every common position, separating play vs Reg from play vs Fish .

1. The grid and the frequencies
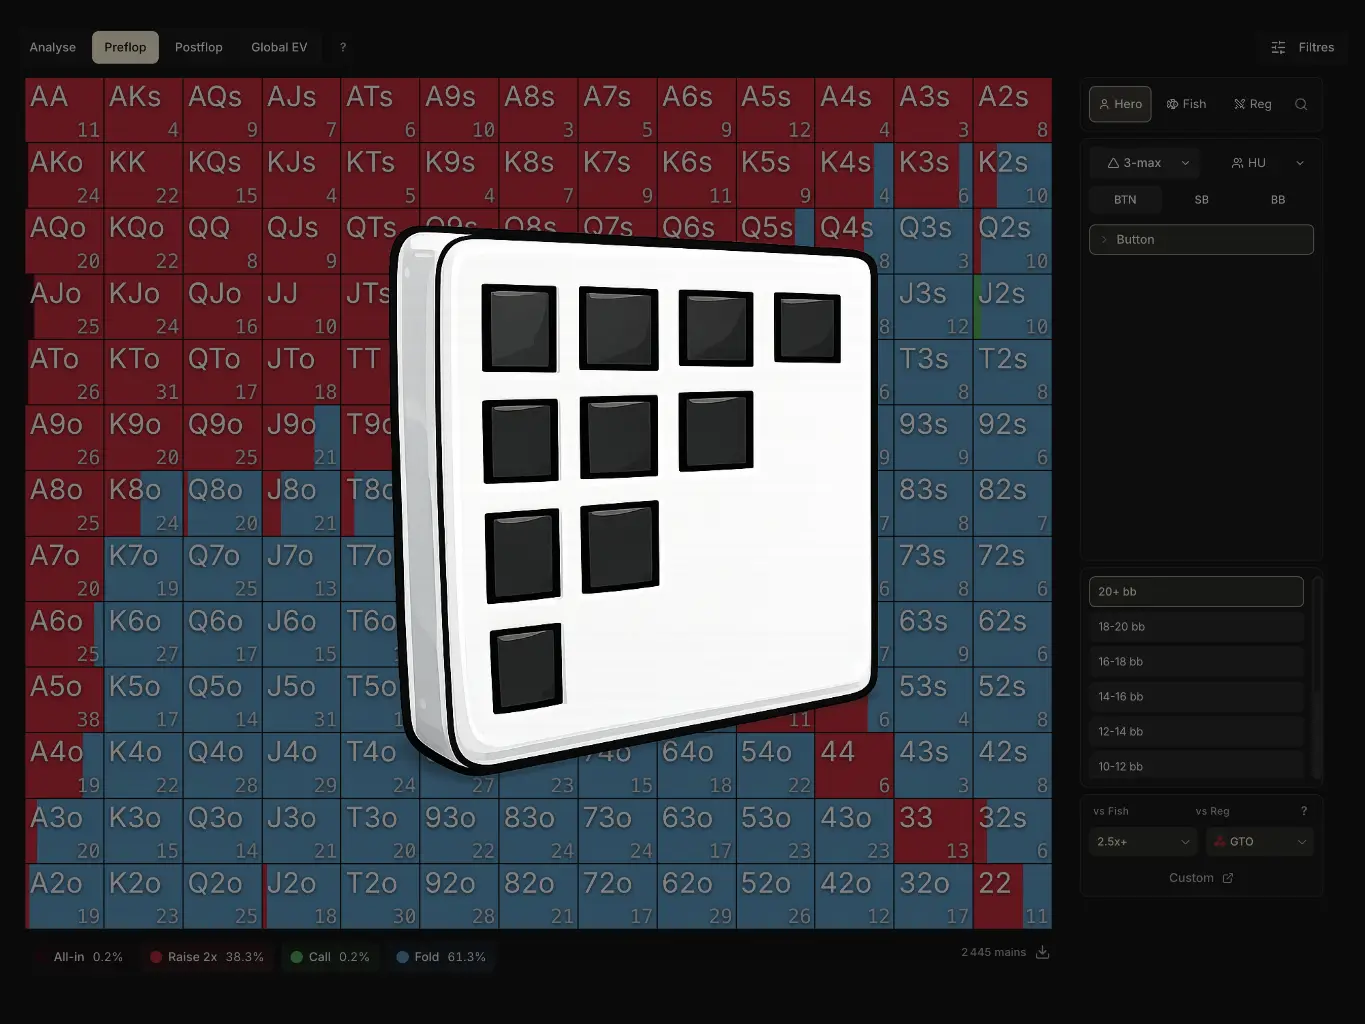
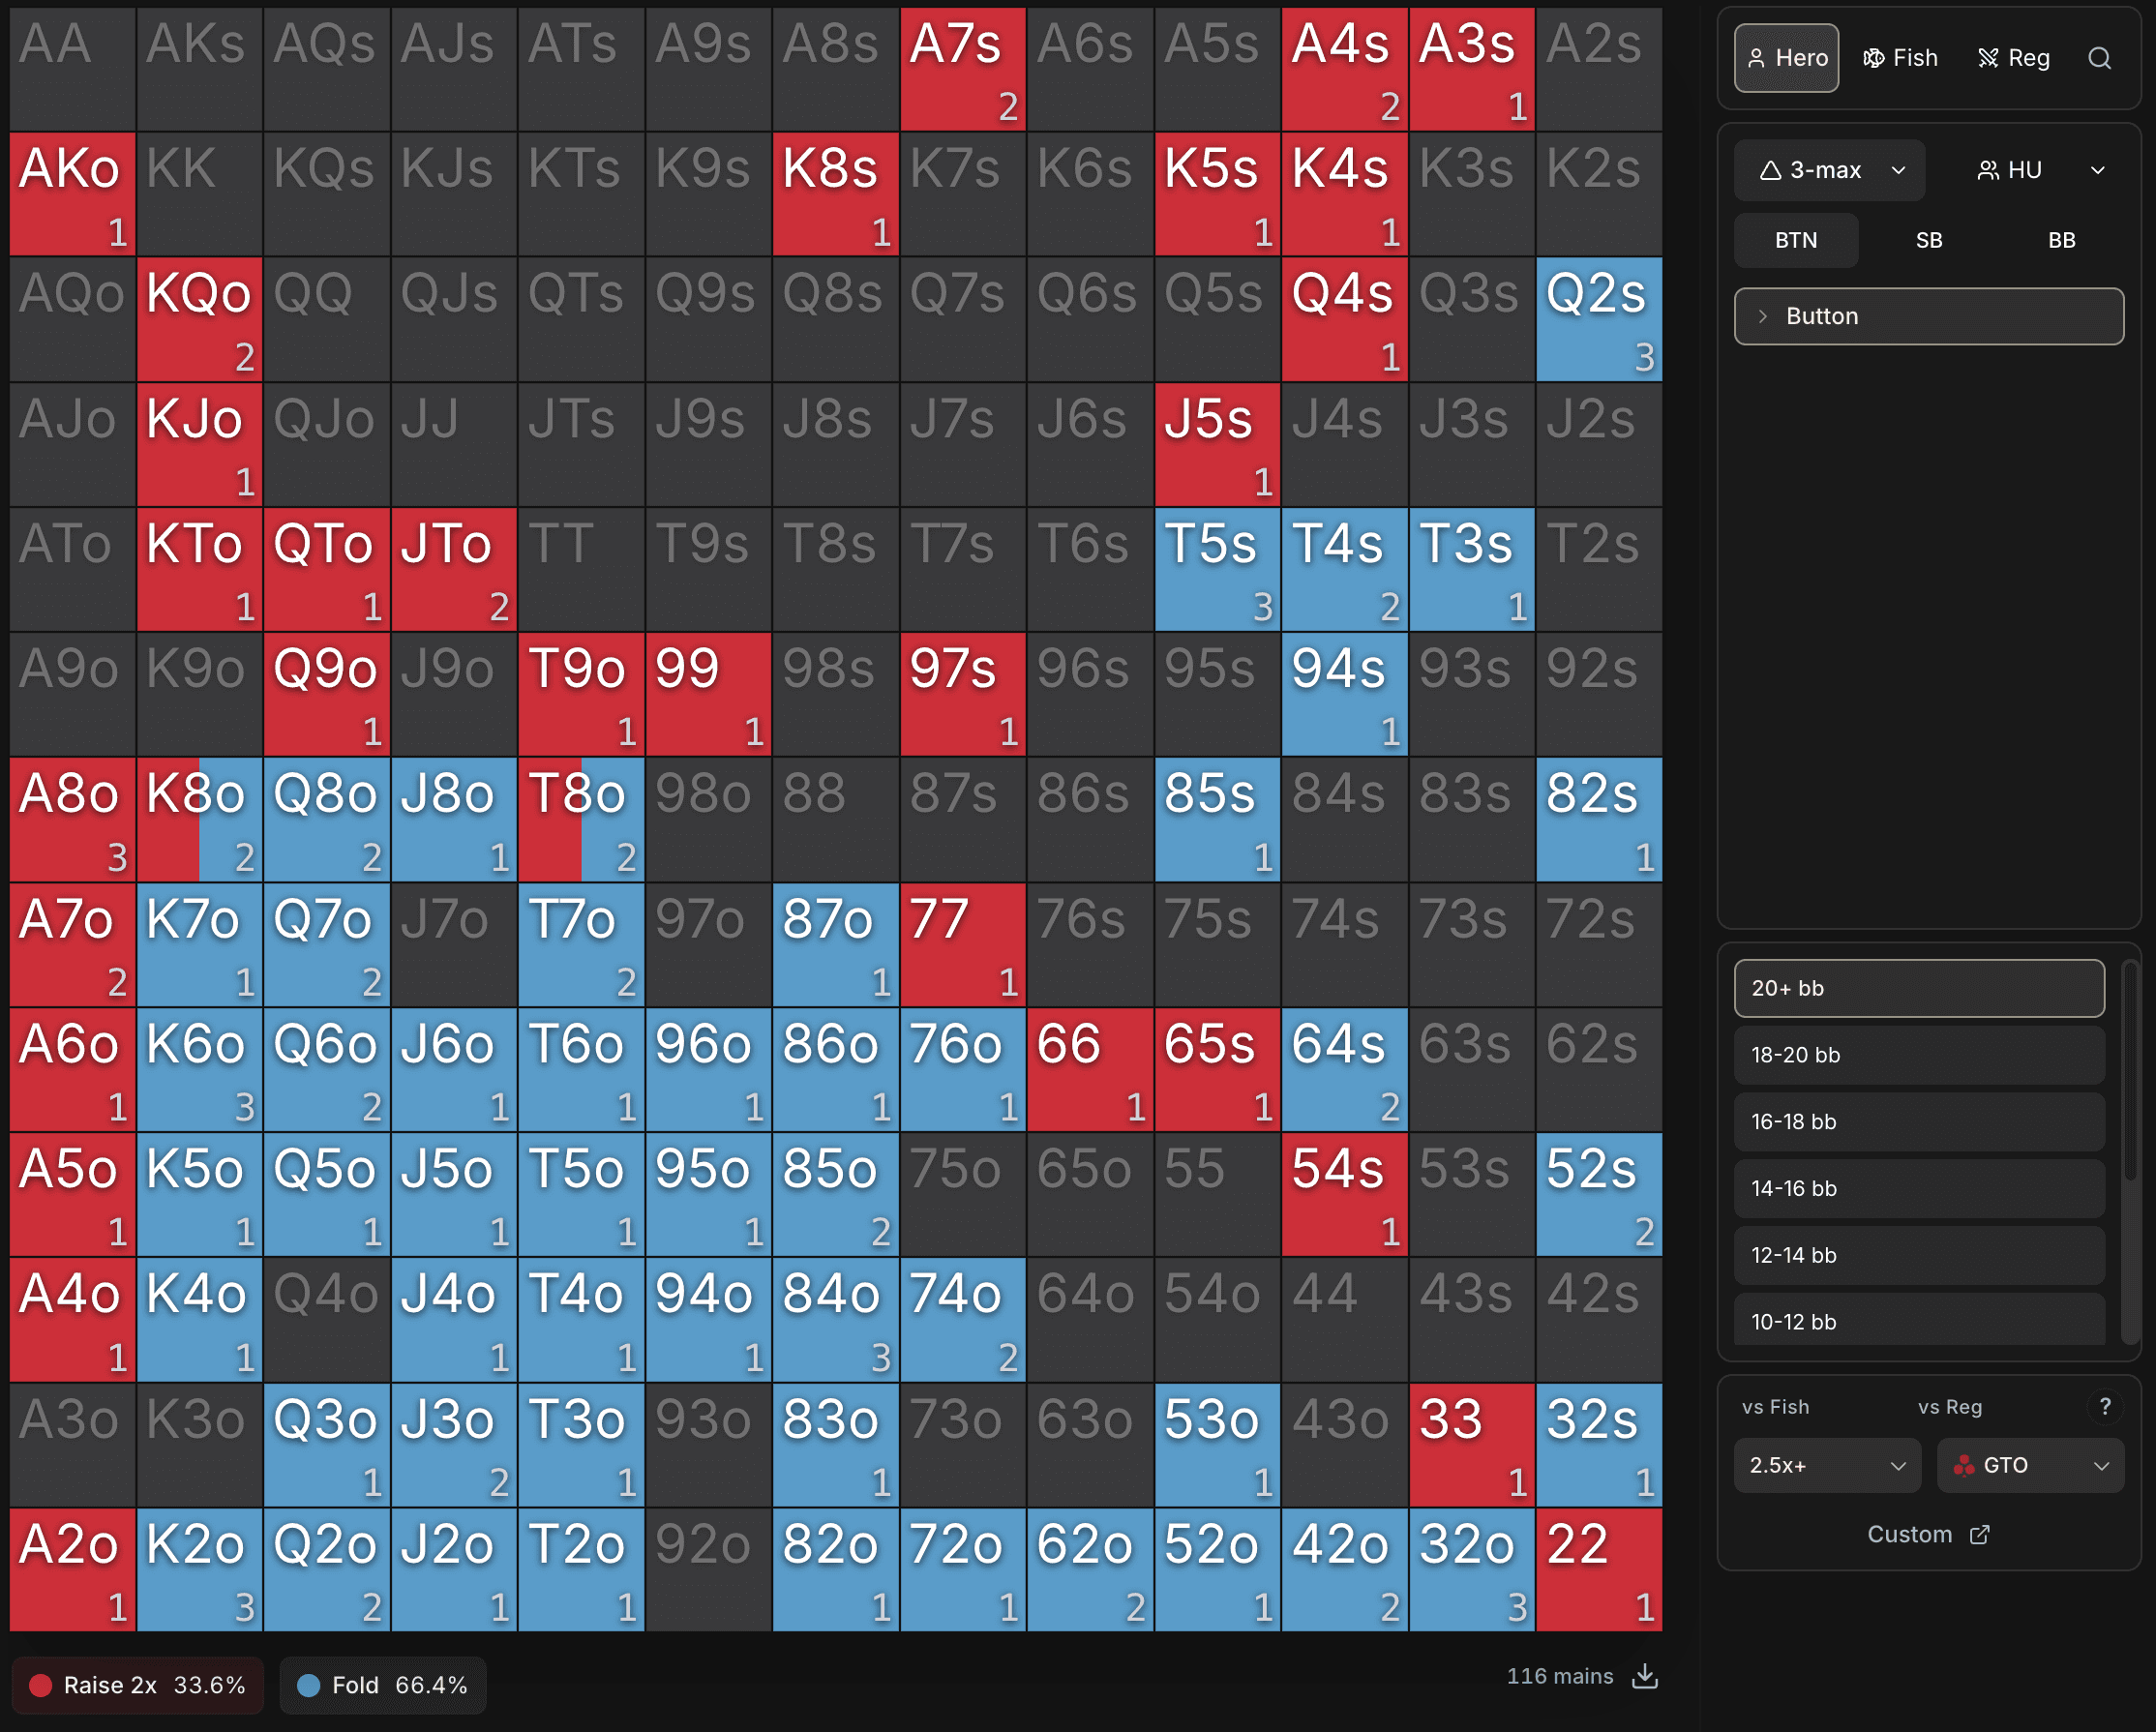
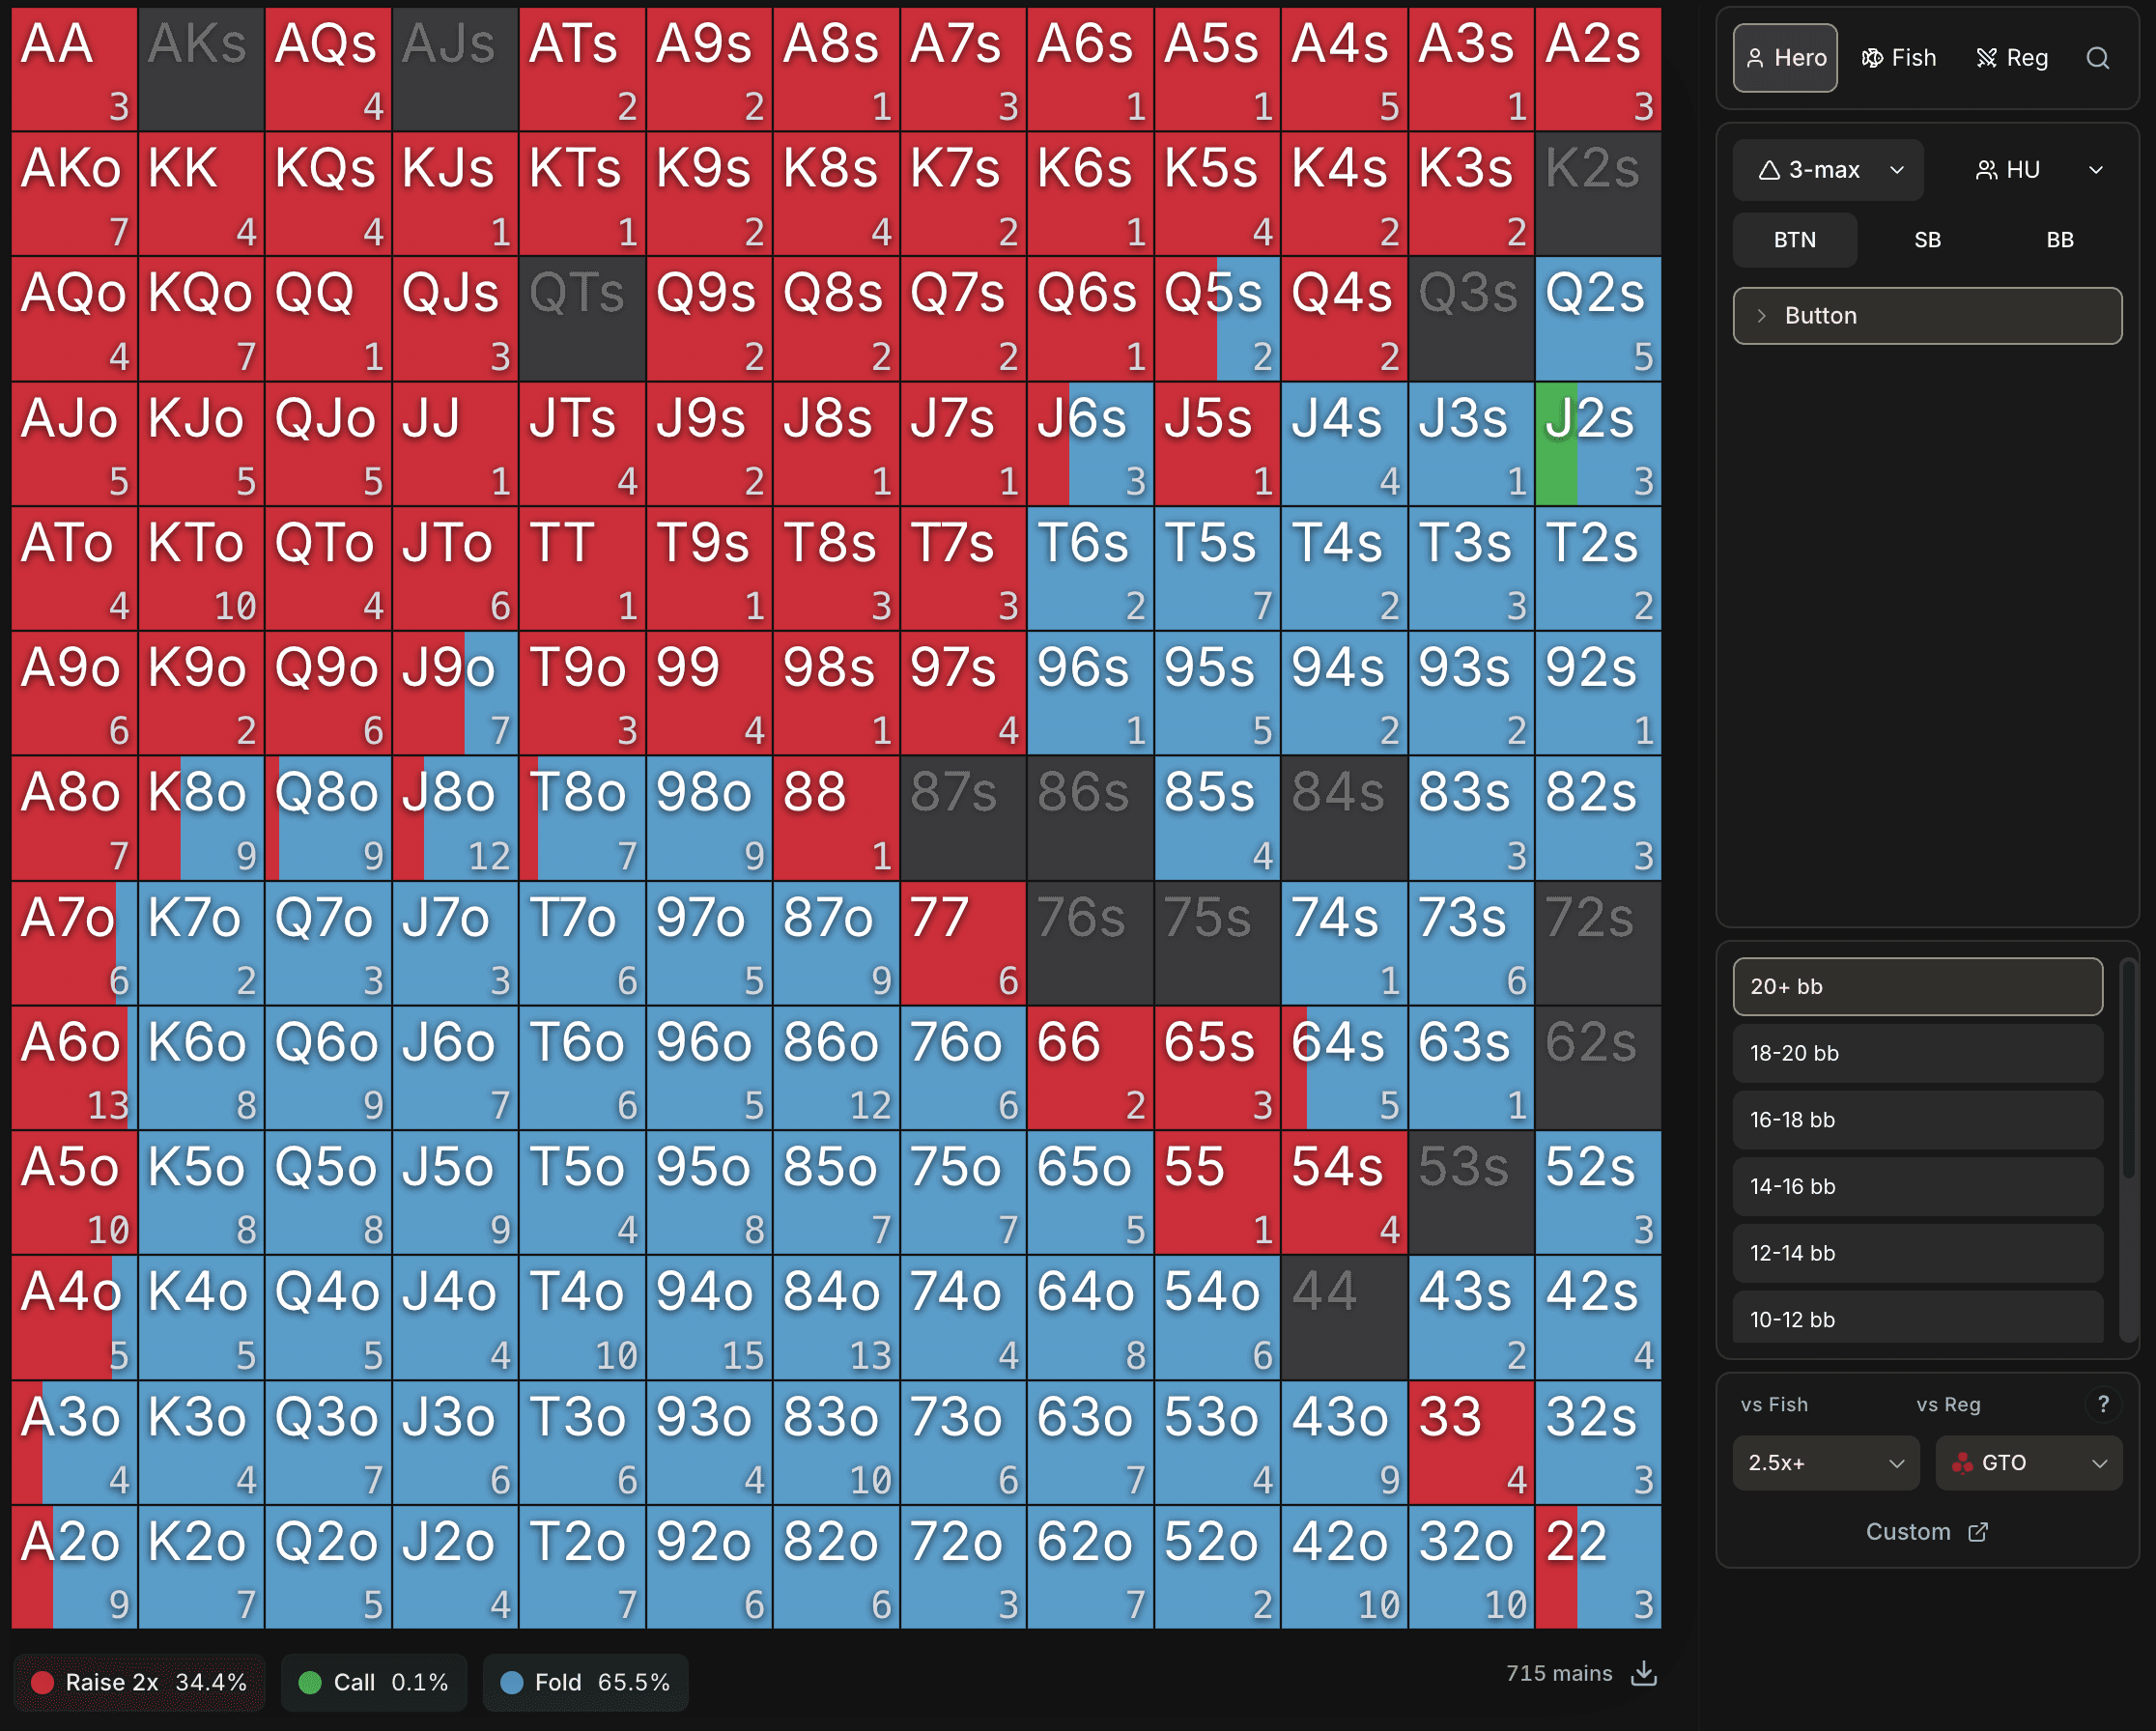
When you open the tab, the BTN 20 bb+ situation is selected by default. At a glance, you visualize your BTN 20 bb+ range: each cell of the grid shows how you played the corresponding hand, with one color per action.
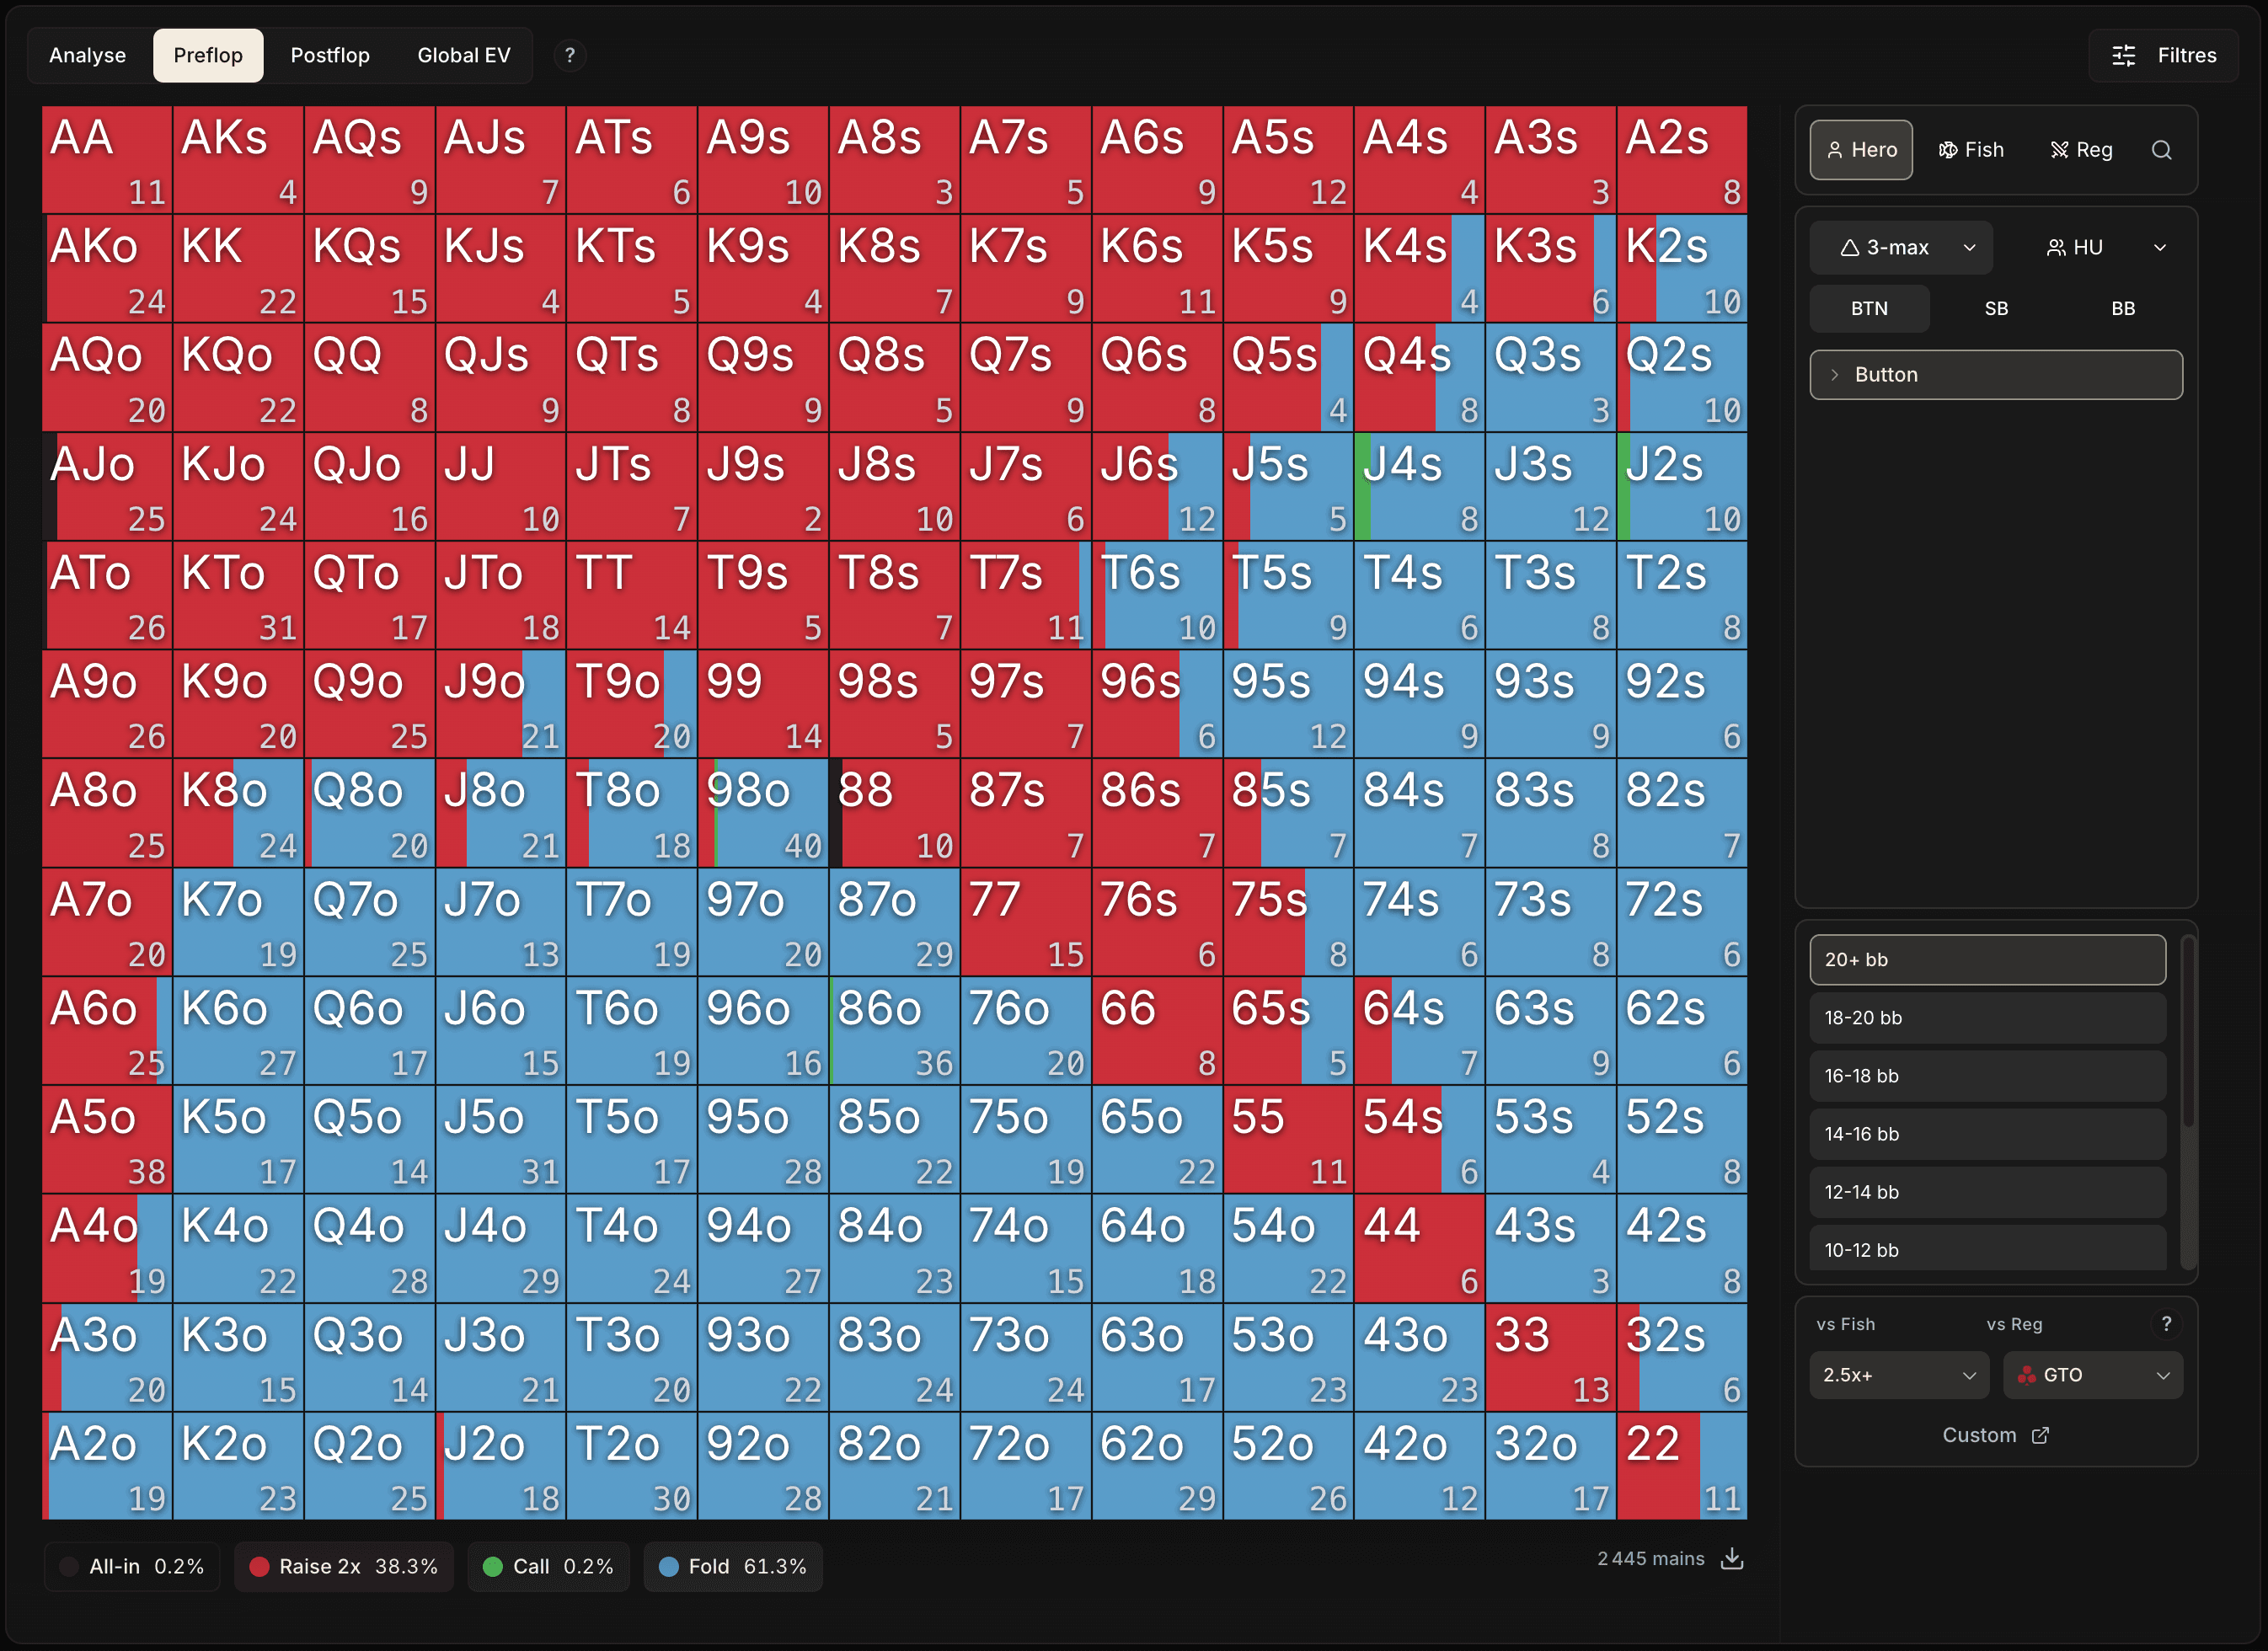
Under the grid, you see the frequencies of each action you took in this situation: Raise, Call, Fold, etc.
Click on an action to isolate that single action on the grid (for example, only show the hands you raised).
2. Comparing to a reference strategy
One of the strengths of this tab is to see where you deviate from a reference strategy.
This feature is the only one in the Leak Finder that requires the Preflop Pack, because it directly uses its Charts and the whole underlying system.
Without it, you can still visualize your preflop game in every situation (vs Fish and vs Reg) and try the reference Chart function on the Button position.
This use is especially valuable for players in the Chart learning phase: visualizing your gaps to the target, hand by hand, is one of the most direct ways to spot the ranges where you make the most mistakes.
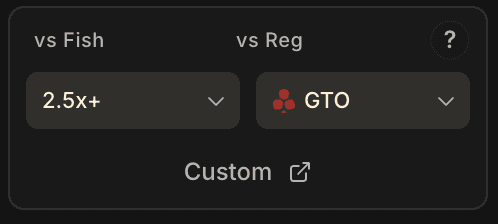
In the sidebar, two dropdown menus (one for vs Fish, one for vs Reg) display the reference Charts for the current context.
On hover over either menu, the corresponding reference Chart gets overlaid on your range on the grid.
You then see at a glance where your range and the reference differ.
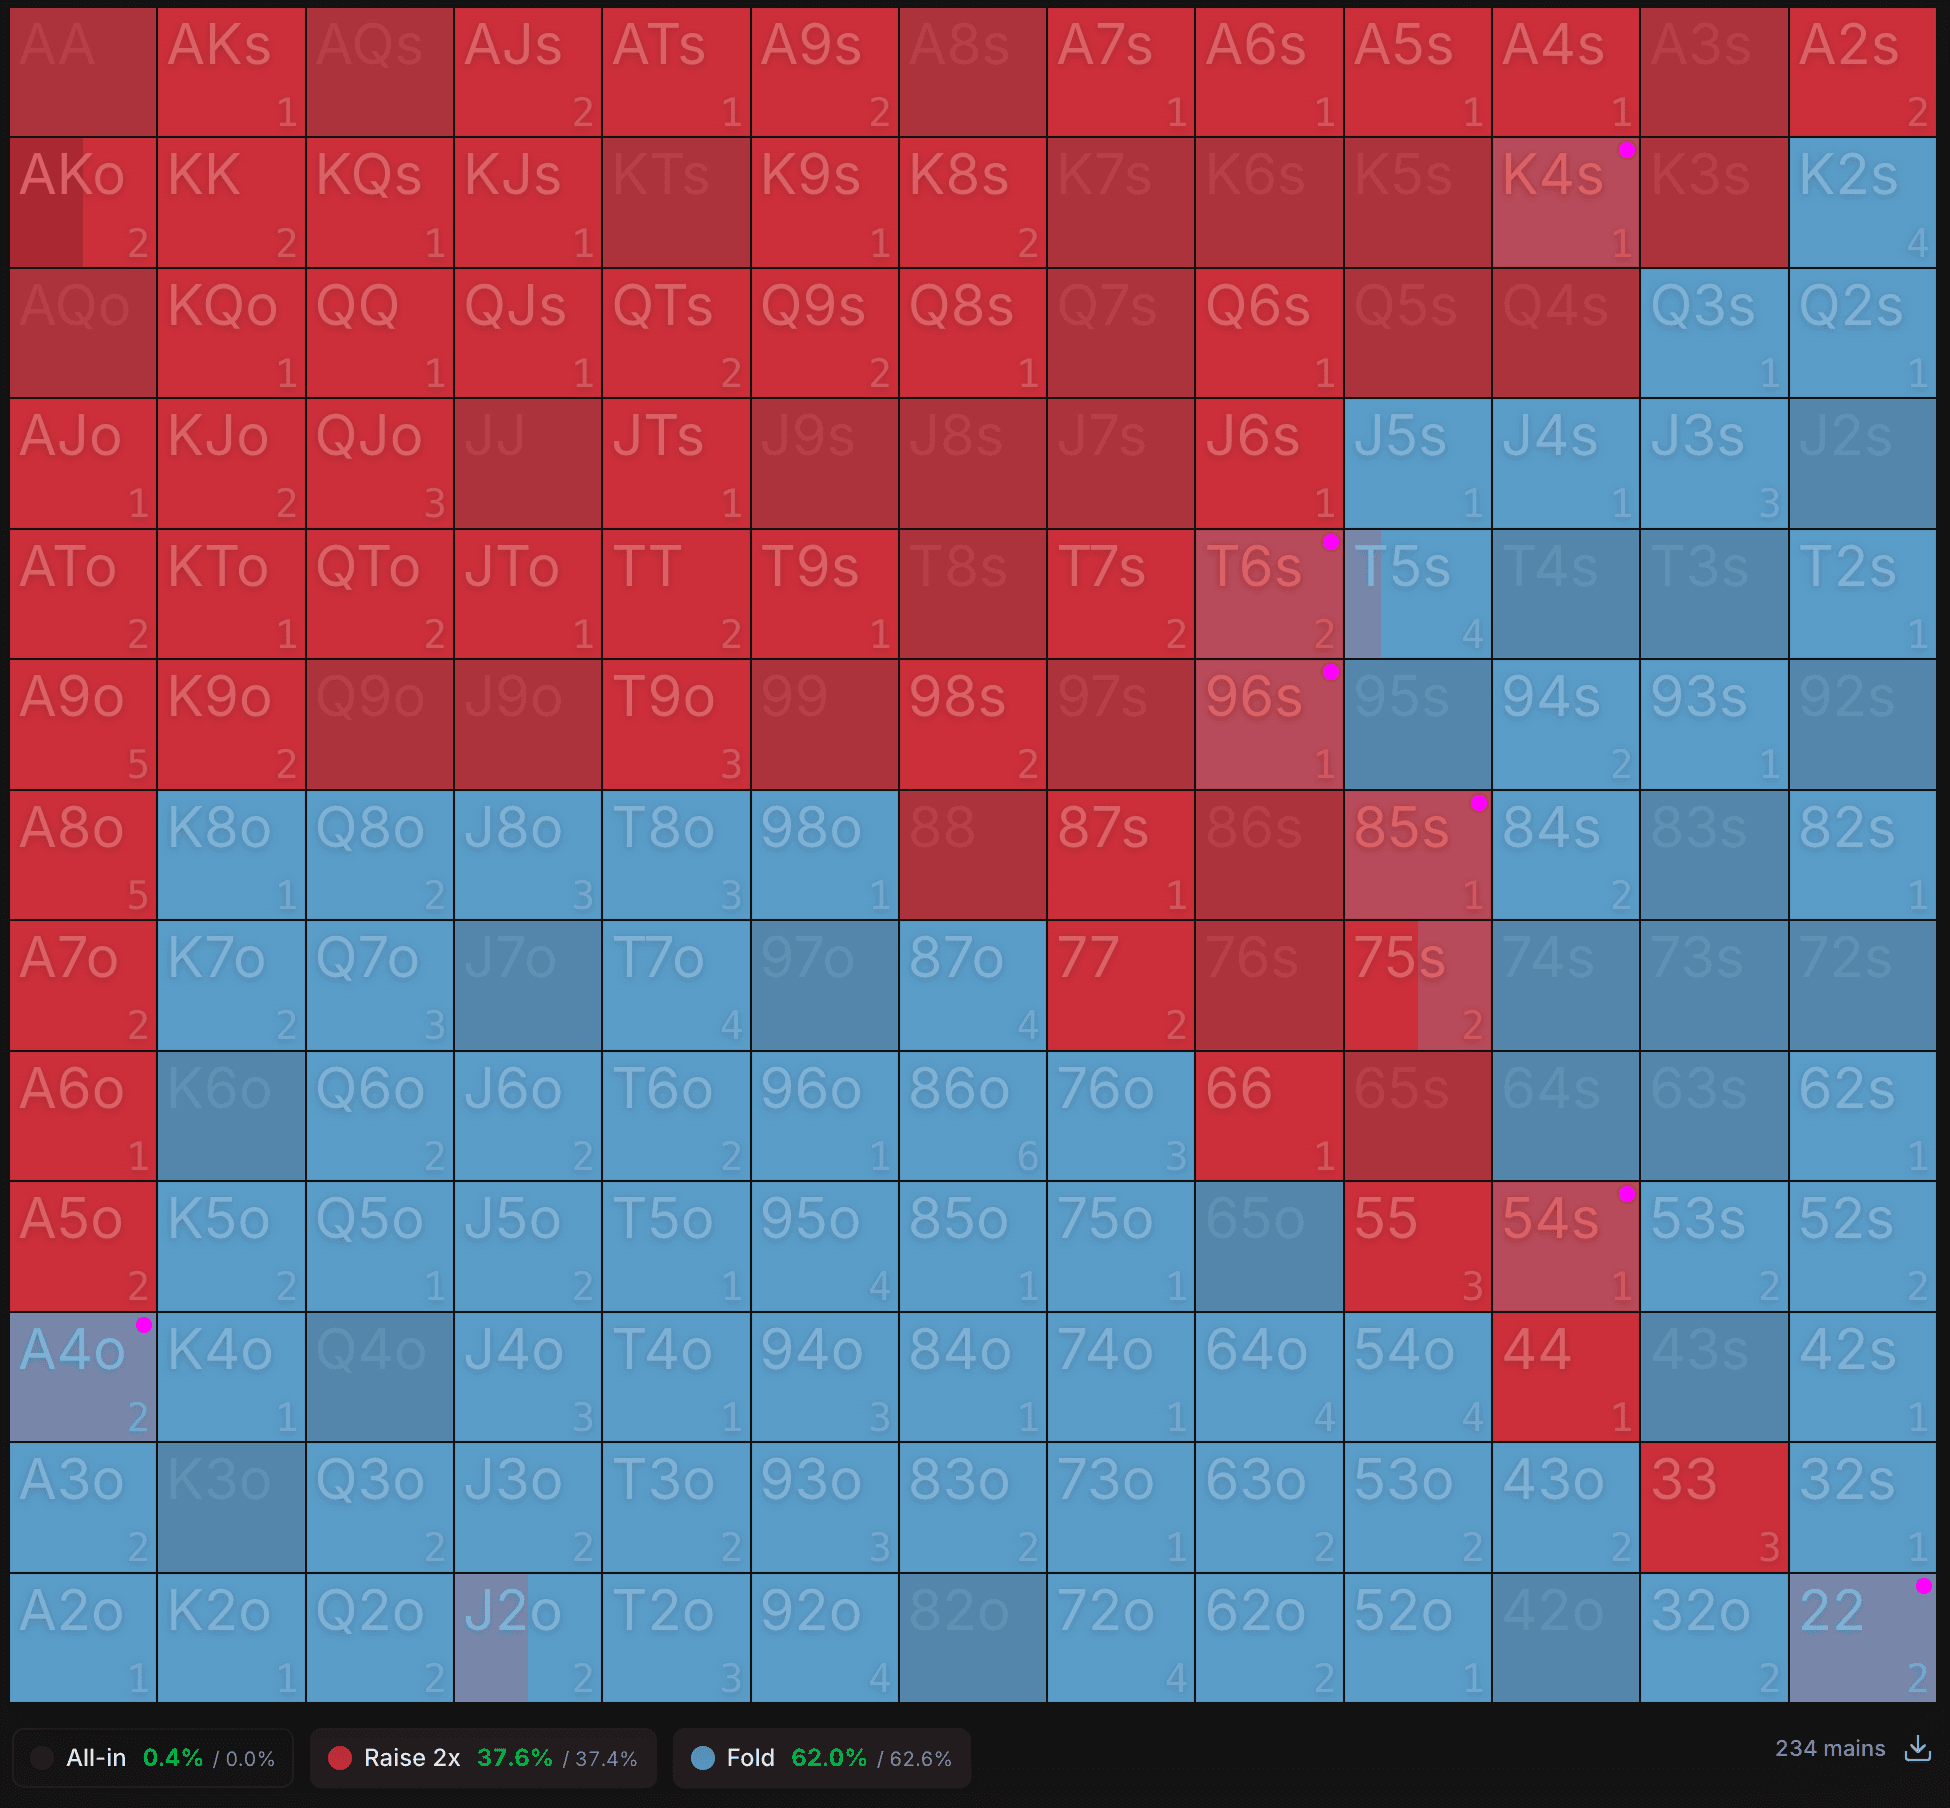
The dots in the corner of the cells flag significant hand-by-hand gaps. They only appear from a deviation of at least 50% between your strategy and the reference on that hand.
- Magenta dot: total deviation (100%). Your strategy is the exact opposite of the reference (you fold what it raises 100% of the time, or vice versa).
- Yellow dot: significant deviation between 50% and 99%.
- No dot: deviation below 50%, the gap stays limited.
Example
The reference plays a hand 50% raise / 50% call. You play it 10% raise / 90% call. You raise 40% less and call 40% more, that is a 40% gap in total.
No dot, we stay below the threshold: the cell simply shows your strategy overlaid on the reference, and it is up to you to judge whether the gap is worth dedicated work.
When a reference Chart is selected, the legend shows your frequency next to the expected frequency. Your number takes a color based on the gap: green if you are on target, blue if you are too passive, red if you are too aggressive.
In the image below, all your frequencies are green: the target is met.
Still in the sidebar, under the reference dropdowns, two global scores sum up the gap across the whole range:
- Hands: percentage of hands you played with the action expected by the reference. Read it as all-or-nothing hand by hand.
- Frequency score: how close your frequencies are to those of the reference. The smaller the gap, the higher the score.
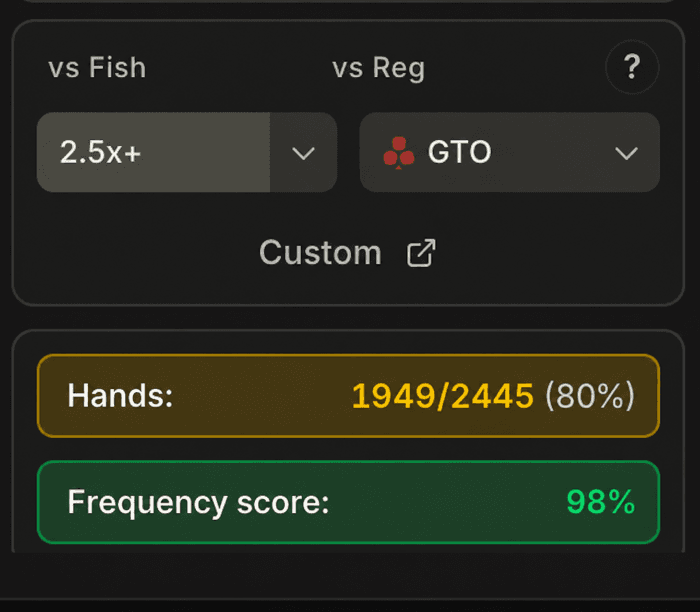
These two numbers mostly serve as indicators: a quick benchmark to see whether the situation drifts away from the reference globally. To understand where the gap actually sits, you need to look at the 13×13 grid itself.
3. Table format and opponent profile
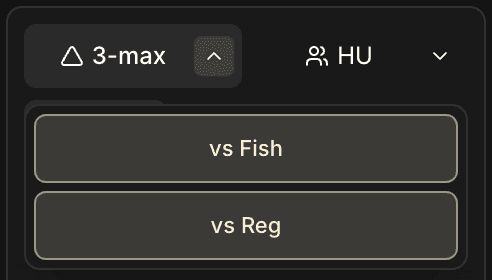
Still in the sidebar, you can specify the situation to analyze: table format ( 3-max or HU), position, and which profile you are playing against (vs Fish or vs Reg). The grid recomputes to only show your hands played in this exact context.
The vs Fish / vs Reg filter is by far the most decisive. Your ranges against a Fish and against a Reg should not be the same. By default, the grid aggregates your hands across all profiles, which makes the comparison to a reference fuzzy.
Filtering on one or the other is therefore essential to isolate the strategy actually used in this context.
This Fish/Reg classification logic applies the same way across the four tabs of the Leak Finder. Once you've grasped it here, it carries over as is to Postflop, Global EV and Analysis.
4. The required volume
A range displayed on too few hands can be misleading, and above all incomplete: most combos haven't been played yet, and the few visible hands aren't enough to describe your real strategy.
Count roughly 500 hands per range as the threshold to start having something usable.
The threshold is not magical. On a very binary situation (all-in/fold play at 12 bb), 500 hands are largely enough. On a mixed situation with four possible actions, it's only a comfortable minimum.
By the way, as you might guess, the number in the bottom right of each cell indicates the number of occurrences for each hand.
A word about variance.
It is not the same for all the tracker's statistics. We often tend to think that everything converges at the same pace, but that's wrong: each indicator has its own stabilization speed.
- The reg/fish ratio of your pool stabilizes after few spins: variance is low, since each opponent is classified in a binary way (either Reg or Fish).
- A preflop range (yours or the pool's) requires a moderate sample per situation, that's the 500 hands threshold we are talking about here.
- The CEV requires far more spins to converge: the variance of EV per tournament is high, and it typically takes several thousand spins for it to become reliable.
- An EV per situation requires even more volume: we slice the data into finer subgroups, so each category gets less signal for the same number of spins.
For preflop ranges, getting 500 occurrences is fairly fast on the situations that come up every tournament (BTN 20 bb+, BB facing an SB open, etc.).
On rarer situations, reaching this threshold can require several thousand spins.
5. Navigating across all situations
There are many stack sizes and many situations. It's hard to go through all of them to find every leak. Two concrete approaches to handle this.
1. Drop by when you're working on a situation.
You are studying BB vs SB open 25 bb and you want to see how you really play it? Open the matching situation in the Preflop tab.
It's concrete feedback on your own game, alongside your theoretical study.
2. Let the Analysis tab do the synthesis.
Rather than scanning every situation by hand, the Analysis tab automatically surfaces the most pronounced gaps and points you to the situations worth opening here.
We will come back to it in detail in chapter 6.6.

6. Reading opponent ranges
So far we have talked about your range. But the Preflop tab also shows, in the same situation, what Fish or Regs do.
Just switch the player selector from Hero to Fish or Reg in the sidebar: the grid then shows the actual range played by the chosen profile in this specific situation.
To read these ranges properly, compare both the action frequencies and the composition of the grid. Here, for example, is the same BB vs BTN open 2x situation at 20 bb+, viewed in turn from the Hero, Reg, and Fish side:
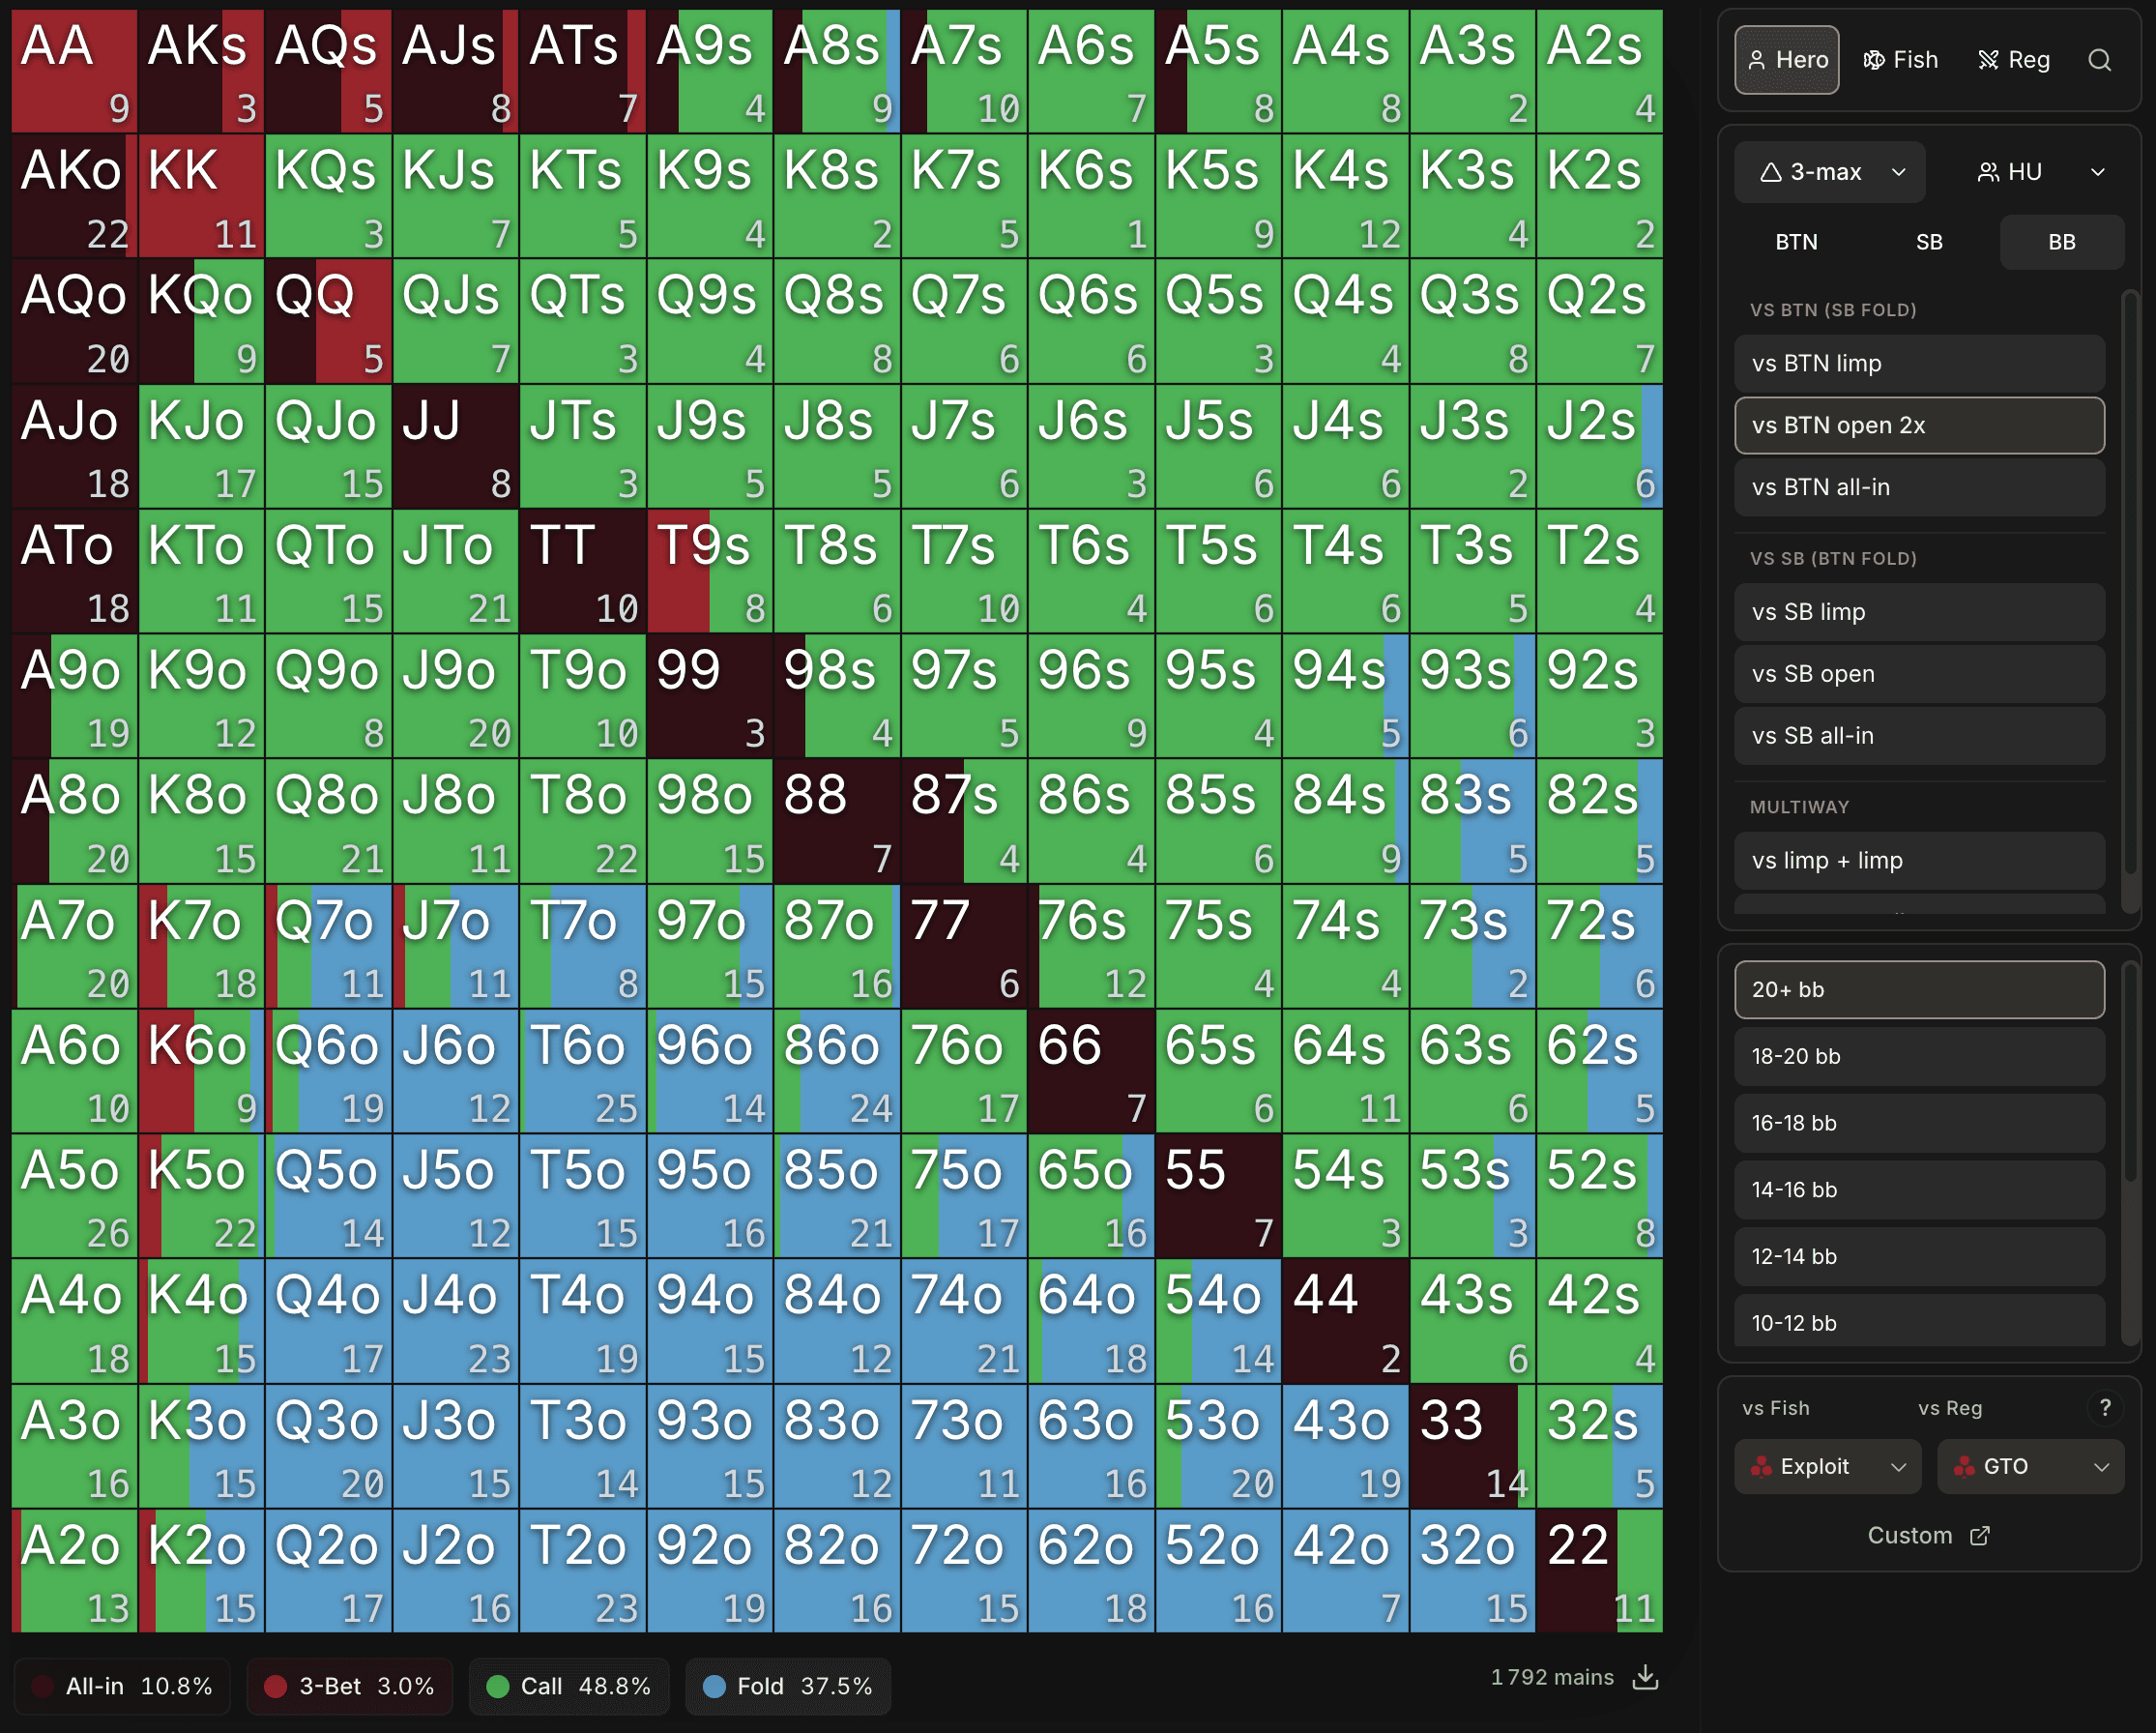
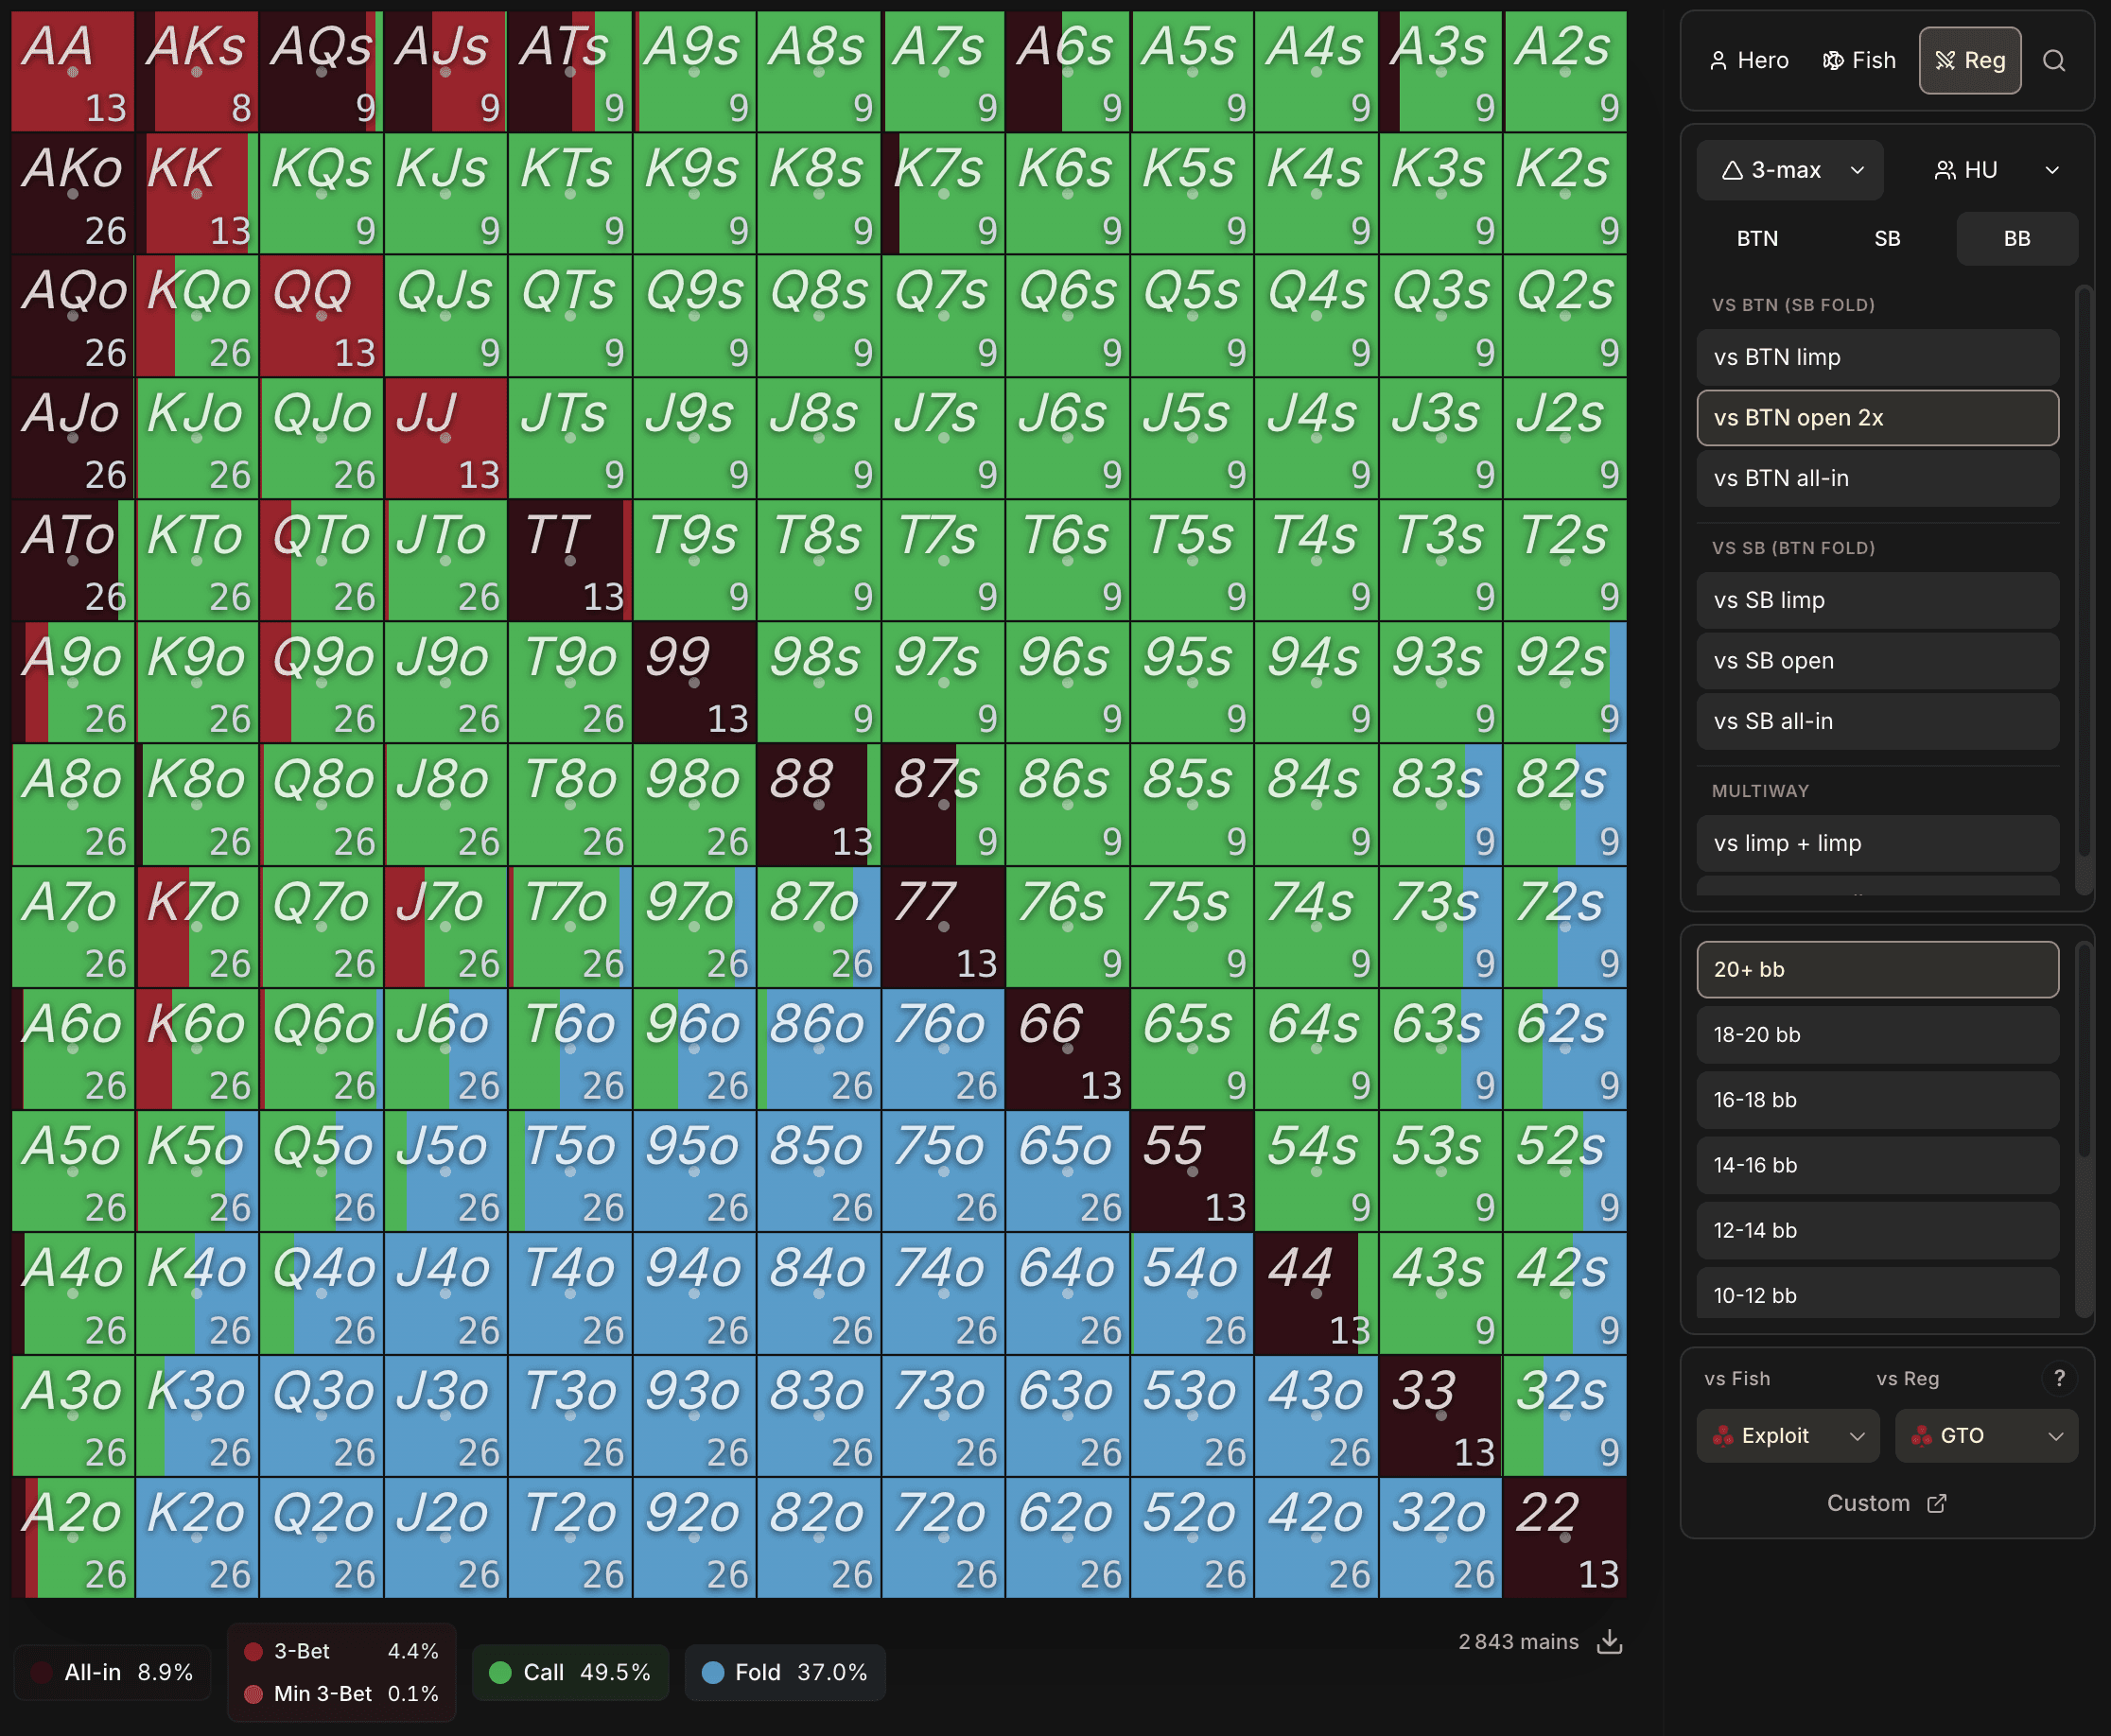
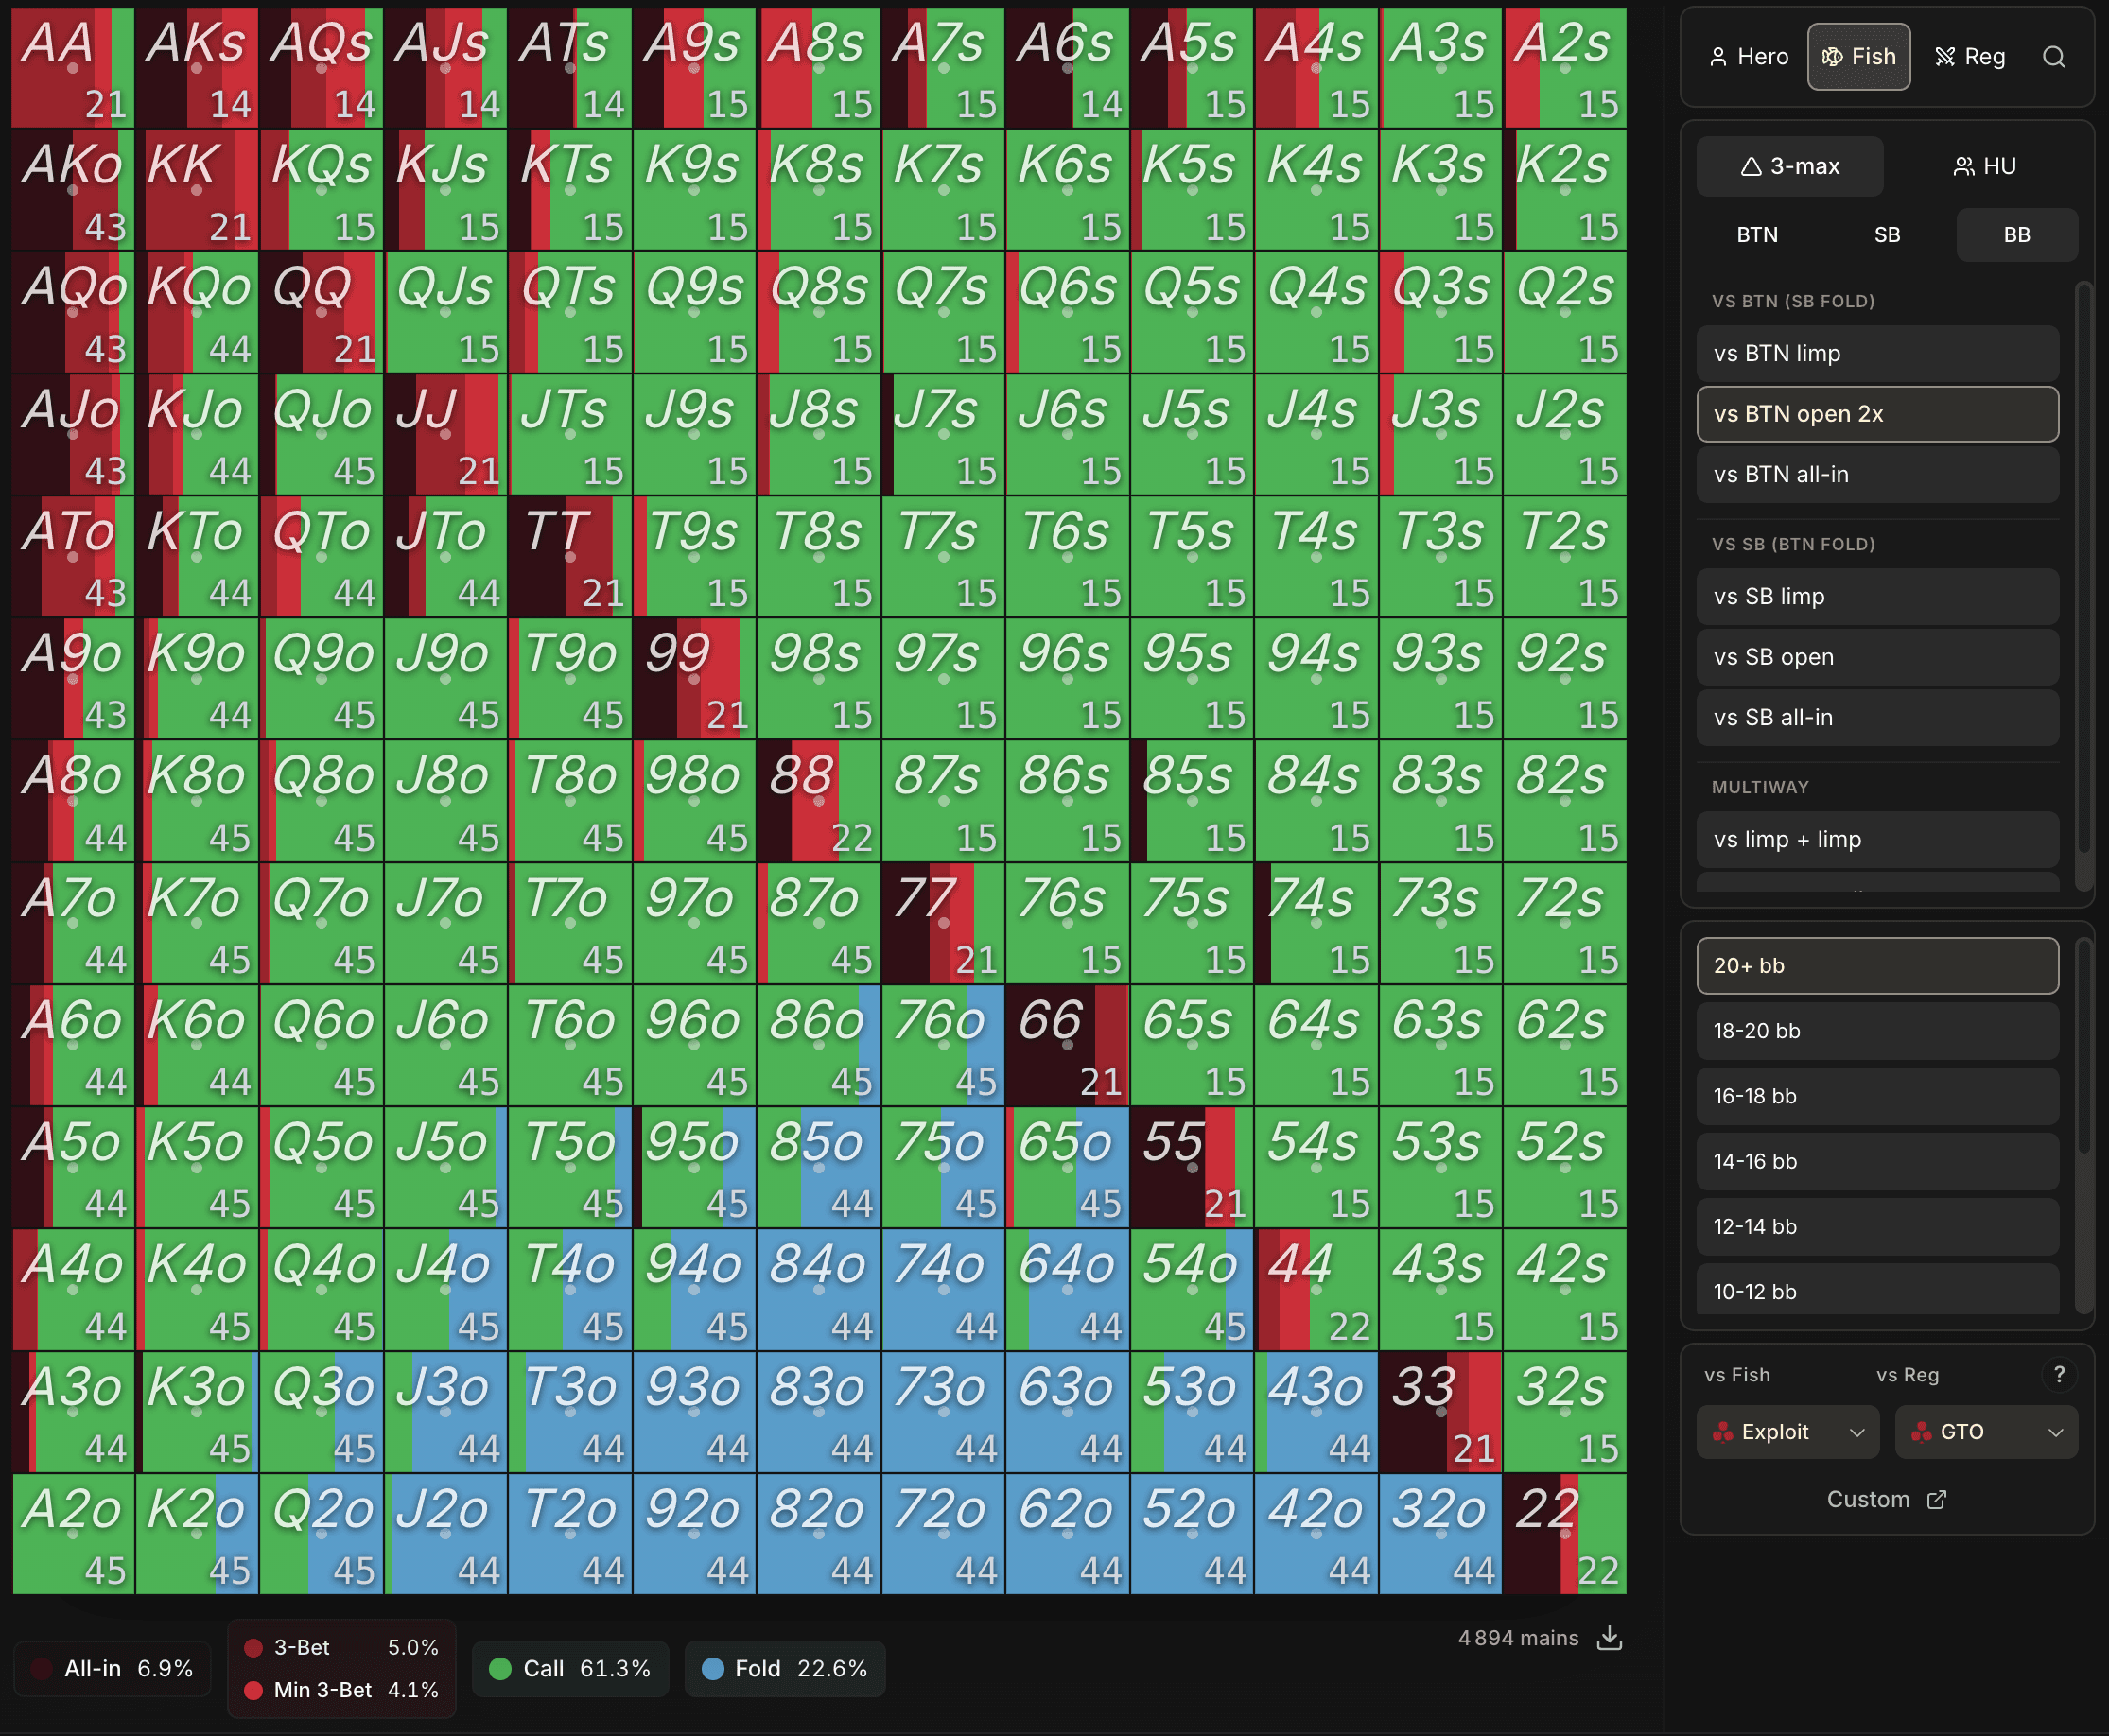
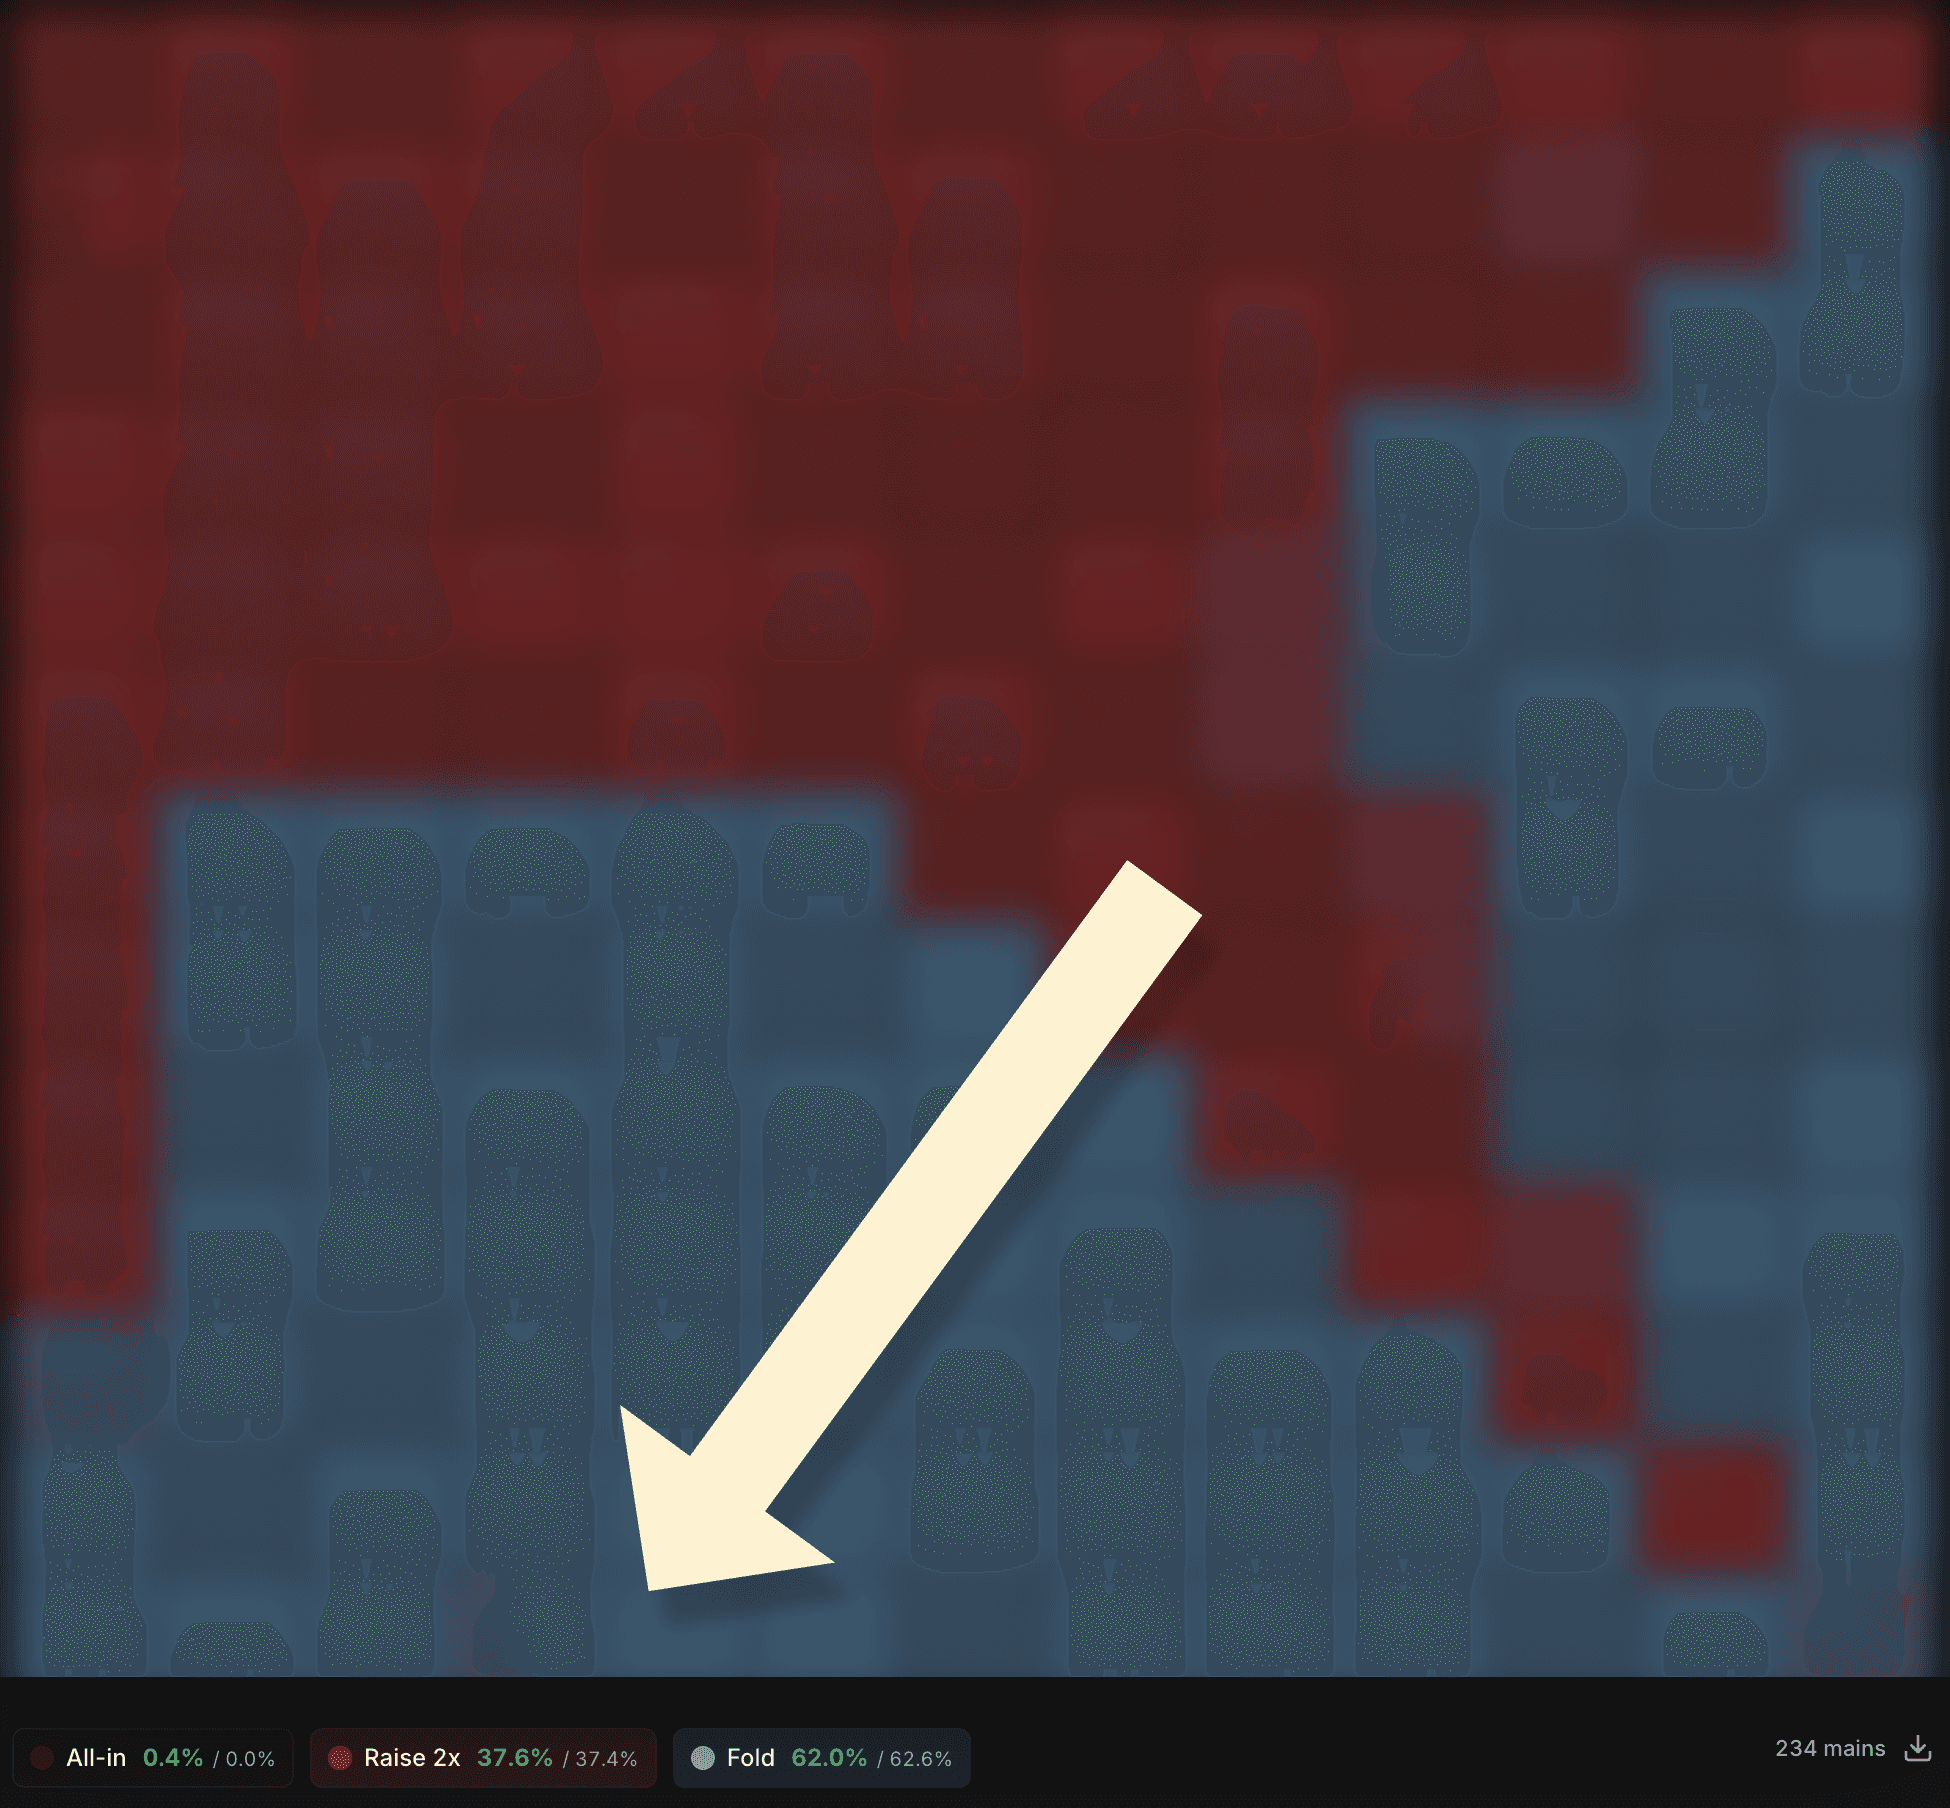
In this specific example, the frequencies already say the essential: Fish defend the BB much looser.
But it is by looking at the composition that the read becomes actionable: with which hands they min 3-bet, which extra hands they call, which hands stay folded.
This second layer is the raw material for exploit strategies.
You might find it surprising to see Folds shown in the Fish or Reg range: by definition, folded hands don't go to showdown, and their cards should therefore never be visible.
And yet, on Poker Spin Tracker the grid is complete. What kind of sorcery is that?
It's simply because a mode is enabled by default when you look at the Fish and Reg range: the Estimate Range toggle, at the top of the grid.
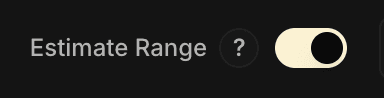
Concretely, Estimate Range fills in the gaps of the grid: for the hands that did not go to showdown, an algorithm statistically reconstructs how the opponent plays them based on the actions observed on the visible hands. You get a much more complete grid than showdowns alone.
That said, it's always worth unchecking the feature to come back to actual showdowns: those are the only pieces of information you have actually observed. And even with the estimation enabled, keep a critical eye: as the name suggests, it's an estimation, not absolute truth.
With these opponent ranges in front of you, let's get back to the essentials. Two very concrete uses stand out from this read of the pool:
Seeing how they really play
We often have preconceptions about Fish that turn out to be wrong (or not) as soon as we look at the data:
They only 3-bet with QQ+
They only raise 3x for value
It's very educational, regardless of any exploit strategy. If you sometimes wonder how Fish (or Regs) play a specific situation, this is where you come to check.
Building exploit preflop strategies
Starting from the range actually played by the pool, you can do what is called nodelocking: you impose this range on a solver, and ask it to compute the best possible response. The output is a strategy that directly exploits the pool's gaps.
The tracker measures and shows. The solver computes the response. Nodelocking is the bridge that connects the two: it turns an observation ("Fish raise 38% on the BTN 20 bb+") into a concrete strategy ("here is how to defend my BB against that").
Be careful, nodelocking is an extremely complex exercise.
Copy-pasting the strategy output by a solver doesn't work: you need to know which range to lock, at which node, with what granularity, anticipate downstream adjustments, check that the deviation stays robust, etc.
It's a topic in its own right that requires the use of a solver and therefore goes beyond the scope of the Academy, we won't go into detail here.
What Poker Spin Tracker is preparing for the future.
Down the line, you will be able to compute directly inside Poker Spin Tracker exploit strategies based on real data from your pool, without going through an external solver.
And for players who want to go further, it will be possible to complete these ranges by hand or to modify them to match your read of the pool.
It's a big project that will come after the creation of the Postflop Pack, but the goal is to bring this observation → strategy path, which today takes several hours of external work, down to a few clicks inside Poker Spin Tracker.
7. Key takeaways
The Preflop tab is the tracker's tool to visualize and compare preflop ranges. It works both ways: your game on one side, the pool's game (Fish and Reg) on the other.
• Visualization: 13×13 grid + frequencies under the grid, on every common preflop situation.
• Comparison (with the Preflop Pack): on hover over the reference dropdowns, your range and the reference are overlaid. Magenta dot = action opposite to the reference, Yellow dot = moderate gap.
• Table format and opponent profile: 3-max / HU and vs Fish / vs Reg, classification based on opponent stats (logic shared across the four Leak Finder tabs).
• Volume: aim for ≈ 500 hands per range at minimum.
• Opponent ranges: switch Hero → Fish / Reg to see how the pool plays. The range estimation fills in the gaps of non-showdowns. Combined with nodelocking, it's the foundation for building an exploit strategy.