
Table quality
Put a number on the quality of your field. Hour by hour.

Gandalf
Co-founder of Poker Sciences
The quality of your tables is the second pillar of the Spin player (covered in the chapter The three pillars of the Spin player).
It is one of the factors that largely dictate your earnings: no matter how well you play, if your field is too heavily packed with regs, your CEV is mechanically capped.
The mathematical reminder comes from Trap 2 of the chapter CEV: traps to avoid: CEV tends toward a finite limit, equal to the sum of your opponents' mistakes minus the sum of your own.
The more fish at your table, the bigger that first sum.
The more regs, the smaller it gets.
Knowing the exact fish / reg ratio of your field means knowing where and when your best grinding windows are: by room, by buy-in, by time slot. And therefore how many opponent mistakes you can hope to exploit.
To measure that ratio, Poker Spin Tracker gives you two tools on the Players page: the Table quality card and the Fish/Reg heatmaps. A quick look is also available in the import summary, already covered in the chapter Fish vs Reg: automatic classification.
The Table quality card
The Table quality card sits in the Players tab, right below the table of your opponents. It gives you the full picture of your field in a single glance, in three blocks laid side by side:
| Block | What it shows |
|---|---|
| Overall | The big ring on the left: the ratio aggregated over the whole filtered selection. The big picture, with its margin of error under the percentage. |
| By day | The ratio broken down by day of the week (7 rings). Spot your softest days. |
| By time slot | The ratio broken down into 3-hour slots (8 rings at most). Spot your softest hours. |
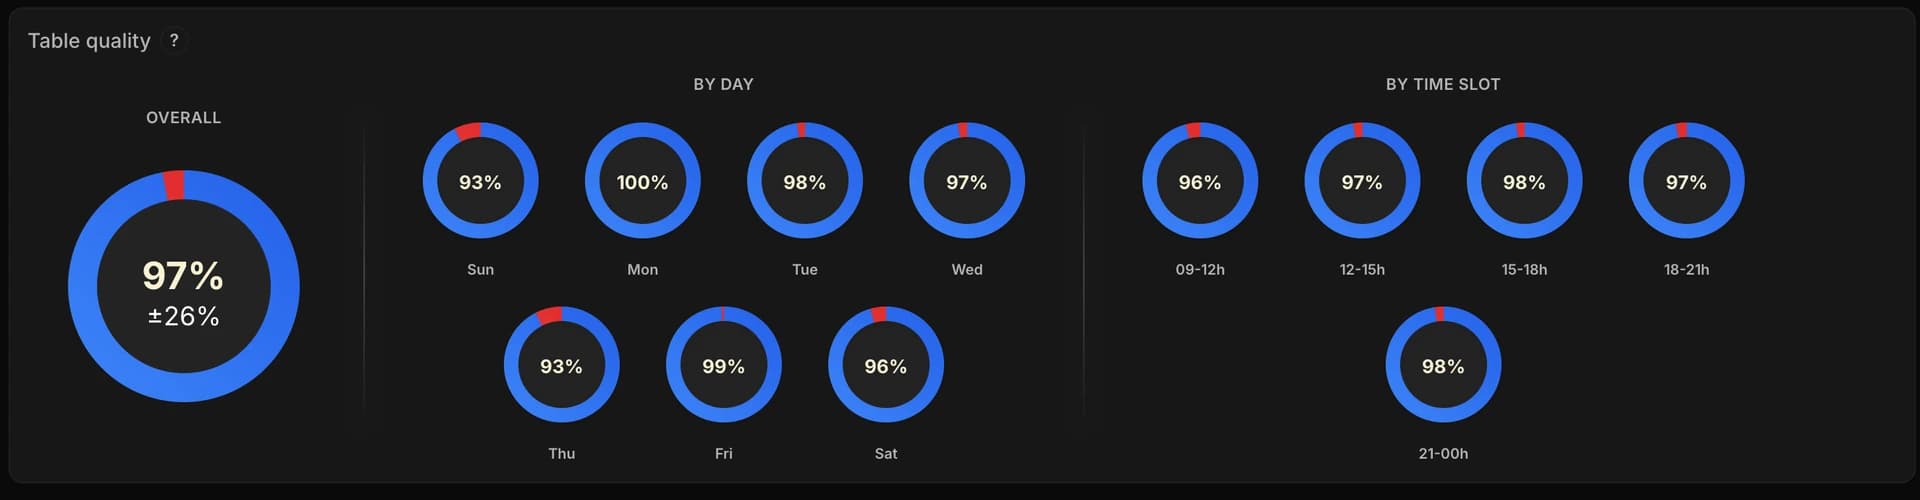
Only the days and slots you actually played in show up: a day missing from your history does not leave an empty ring behind.
And since the percentage in the middle doesn't tell the whole story, hover a ring: the tooltip details the number of tournaments in that slot and the exact fish / regs split, plus the unclassified seats if there are any.
Those seats come from the rooms that anonymize their players, GG Poker first among them (see The Players page). They take up the gray slice of the ring, but they never enter the percentage in the middle, which always reads fish / (fish + regs).
Every filter on the Players page applies: Date, Buy-ins, Number of tables, Spin type and Room.
So you can ask very targeted questions:
What is my fish ratio at €2 on Winamax, on Saturday evenings?
Or:
How has the quality of my field changed over the last three months?
It is this cross-referencing with the filters that turns a raw number into a reading you can act on.
The Fish/Reg heatmaps: three cross-referenced grids
The Fish/Reg heatmaps go further than the By day and By time slot blocks, but they are also more demanding.
They live just underneath, below the first screen of the Players tab: keep scrolling and you find three stacked grids, each one crossing two dimensions of time to break down the quality of your field:
| Grid | Cross-reference | What it is for |
|---|---|---|
| Day × Hour | 7 days × 24 hours (168 cells) | The most direct grid: which day, at which hour, is my field softest? |
| Day × Week | Day of the week × week of the year | See whether a day of the week hardens or softens over the course of the year. |
| Month × Day | 12 months × 31 days of the month | Spot a recurring calendar effect: start of the month, holidays, festive periods. |
In practice, only the Day × Hour grid is genuinely usable for most players, and even that one already demands a lot of data. The other two (Day × Week and Month × Day) are reserved for players with several years of history spread out over time.
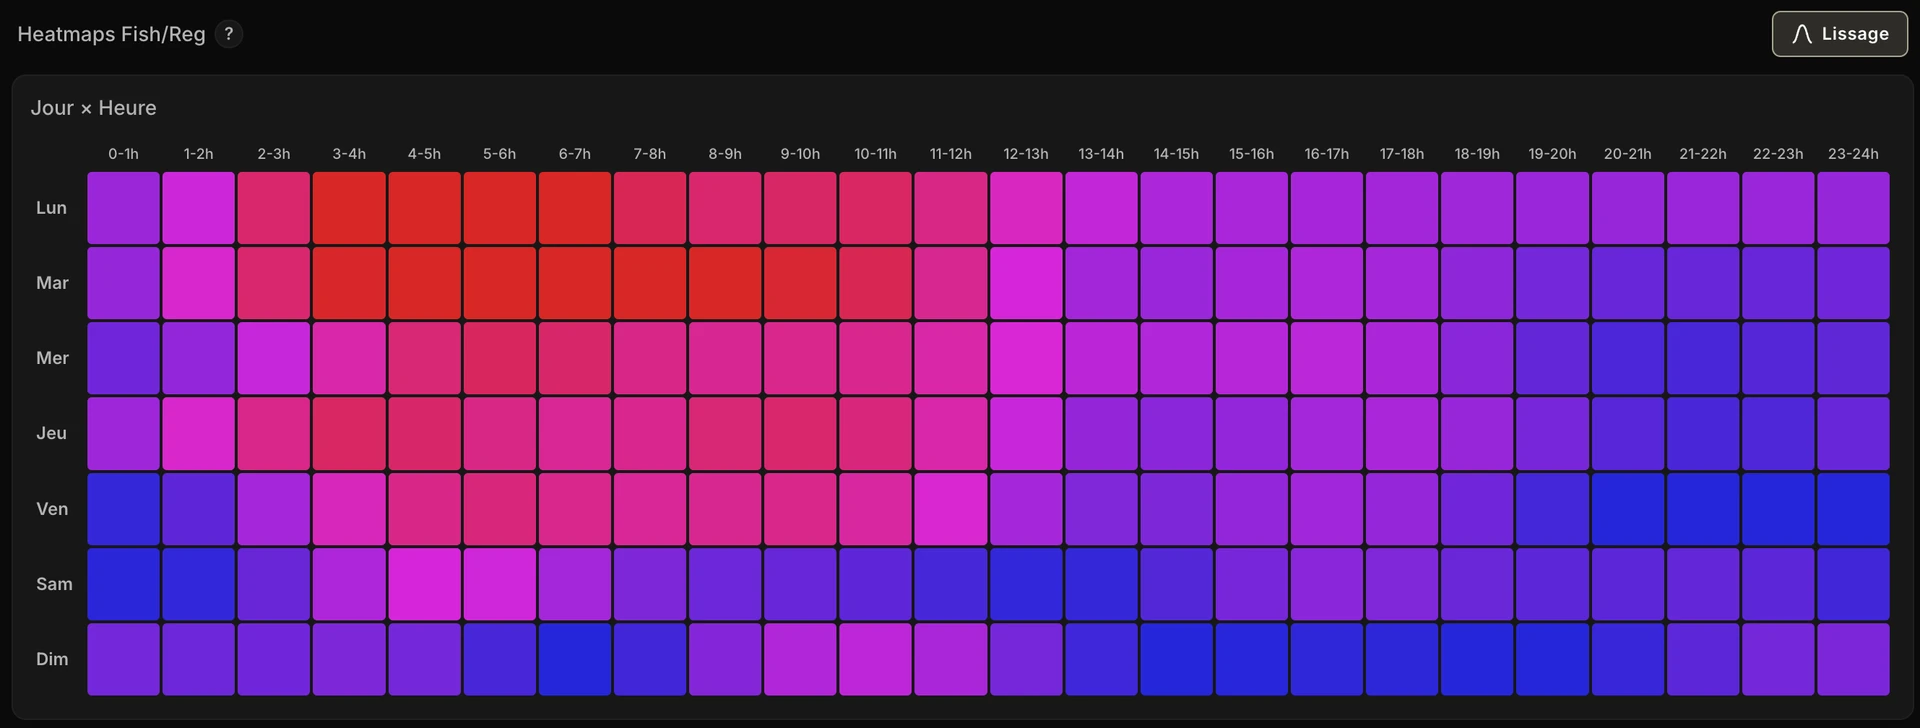
Color code
From red (the least soft slot in your history) to blue (the softest), with purple for everything in between. Careful, the scale is relative to your own data: a stark color difference may amount to only a few percentage points, especially with smoothing on. Always check the exact value on hover.
Hovering a cell opens a tooltip with a mini Table quality ring for that slot and the number of tournaments you played there, which keeps you from drawing conclusions off a cell with 5 games in it.
Be wary of volume. Even the Day × Hour grid only becomes readable under two conditions: enough games to fill the 168 cells, and regularity in your grinding habits (playing roughly the same hours on the same days, week after week). Without that stability, some cells show up, others stay empty, and comparisons become fragile.

Smoothing
At the top of the section, a Smoothing button drives all three grids at once.
It is on by default: the first grid you see when you land on the page is therefore already smoothed.
Why it exists
In most histories, some slots are rare or empty: you may never have played on a Tuesday at 4 a.m., or barely at all on a Sunday at 11 a.m. Without smoothing, those zones leave holes that break the overall reading and suggest there is nothing to see in that slot.
What it does
Every cell is recomputed from its closest neighbors in time, up to 3 cells on each side. It is a weighted average, the classic statistical method for smoothing a series: the closer a neighbor is, the more it counts, and the more tournaments you played in it, the more weight it carries.
Smoothing invents nothing. An empty cell is only estimated if one of its two immediate neighbors goes above 100 classified tournaments (Day × Hour) or 20 (the other two grids). Below that, the cell stays empty.
How to spot an estimated cell
It carries a dotted border, and its tooltip shows "(estimated)" instead of the number of tournaments.
Should you turn smoothing off? Left on, it is the setting that gives the most usable reading, especially while your history is still short. Turn it off when you want to check that a specific cell really rests on data, and not on an estimate.
What to actually do with it
The card and the heatmaps are meant to be read together. Five ways to use them:
- Spot your best slots to grind: cross-reference the By day and By time slot blocks (or go straight to the Day × Hour heatmap if you have the volume) to identify the hours and days when your field is softest, and schedule your biggest sessions there.
- Compare the fish ratio across your stakes through the Buy-ins filter. A stake is sometimes softer (or tougher) than you would expect, and it is then worth spending a few weeks there while it lasts.
- Compare rooms if you have volume on several of them, through the Room filter. You can then convert those ratios into expected CEV gain with the cEV & Profit Fish/Reg curve from the next chapter, to decide which room to favor.
- Track how it changes over time. The quality of a room, of a buy-in or of a time slot changes. Filter by date to see what is hardening and what is softening.
- Cross-reference with your CEV to run real profitability analyses, both on the choice of your grinding slots and on the choice of your stakes. That is exactly what CEV vs Fish concentration, the next chapter, measures.
Be wary of promotions. Leaderboard, rake race, added value tournament: they mostly attract regs, and they harden the field for as long as the promotion runs. A slot that degrades sharply over a single month is more often a promo than an underlying trend.